Falcon
FinTechModernizing FinTech Infrastructure with AWS ECS & PCI-DSS Compliance
How Falcon achieved 99.99% uptime and PCI DSS readiness using AWS ECS, DevSecOps automation, and disaster recovery archi...
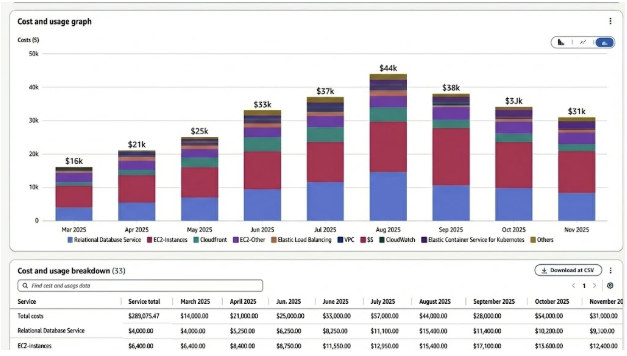
A fast-scaling FinTech startup saw AWS spend rise steadily through 2025, peaking at ~$44K in August. The platform was stable and production-ready, but cloud costs were increasing faster than expected driven by rapid scale, evolving workloads, and the absence of strong FinOps guardrails.
Like many growth-stage startups, the team faced:
SquareOps started operations in late August and ran a focused FinOps optimization program designed to:
Outcome:
Within months of engagement, AWS spend reduced from ~$44K (August) to ~$31K (November) while maintaining platform reliability.
When SquareOps engaged in late August, we analyzed historical AWS spend trends to understand how and why costs were growing, not just where they appeared in billing dashboards.
Using service-level spend patterns commonly surfaced in tools like AWS Cost Explorer (to help readers correlate the data), we observed the following across March–November 2025:
Our analysis showed spend concentration typical of a fast-scaling FinTech platform:
Service | What We Observed |
RDS | Largest and most consistent contributor, increasing month over month |
EC2 | Second-largest cost block, reflecting steady-state overprovisioning |
Supporting services | CloudFront, ELB, VPC (NAT + data processing), S3, CloudWatch, and EKS added incremental but compounding cost |
Key Insight:
The data did not point to a single “bad month.” Instead, it revealed a cost model that would continue to compound as the startup scaled, unless ownership, right-sizing, and ongoing FinOps discipline were introduced.
The FinTech startup’s engineering leadership faced three common growth-stage challenges:
Spend was spread across databases, compute, observability, and networking—making it difficult to quickly answer “what changed?” after each scale event.
Without consistent tagging and ownership mapping, teams could not reliably connect infrastructure spend to:
As a FinTech platform:
Two-Phase Execution: Stabilize → Optimize
We decomposed AWS spend by major services:
This allowed us to distinguish:
We introduced a lightweight but enforceable tagging standard, covering:
This gave the startup immediate cost attribution without heavy process overhead.
Each optimization opportunity was ranked by:
Only high-impact, low-risk changes were prioritized first.
What we observed
What we changed
Why it worked
RDS was the largest cost block; even moderate efficiency gains delivered meaningful absolute savings.
What we observed
What we changed
Why it worked
EC2 was the second-largest driver; improved utilization directly reduced the monthly run-rate.
What we observed
What we changed
Why it worked
CloudWatch optimizations typically produce quick wins with minimal risk, especially in scaling startups.
(VPC / NAT, CloudFront, ELB)
What we observed
What we changed
Why it worked
Networking costs behave like a “tax”—removing inefficiencies lowered spend without touching application logic.
Given the startup’s growth pace and production sensitivity:
No application refactors – developer velocity preserved
After SquareOps engagement began in late August, AWS spend reduced month over month:
Month | AWS Spend |
August (Peak) | ~$44K |
September | ~$38K |
October | ~$34K |
November | ~$31K |
The startup didn’t just reduce spend, it gained durable cost control.
SquareOps helps fast-scaling teams reduce cloud spend safely without downtime, performance impact, or slowing engineering velocity. Our production-ready FinOps approach delivers measurable savings while building long-term cost control. Let’s identify where your AWS spend can be optimized.
See how we've helped other businesses transform their infrastructure.
How Falcon achieved 99.99% uptime and PCI DSS readiness using AWS ECS, DevSecOps automation, and disaster recovery archi...
See how SquareOps migrated a regulated NBFC workload from GCP to AWS with zero data loss, RBI-aligned security, and scal...
Learn how SquareOps supports OurShopee with 24×7 Managed DevOps services to ensure high availability, rapid incident res...