Introduction
Site Reliability Engineering (SRE) has grown from a buzzword to a core function in modern cloud-native organizations. With growing businesses, systems' reliability, performance, and scalability become a top priority. Amidst all this, the right set of tools and technologies become a critical consideration.
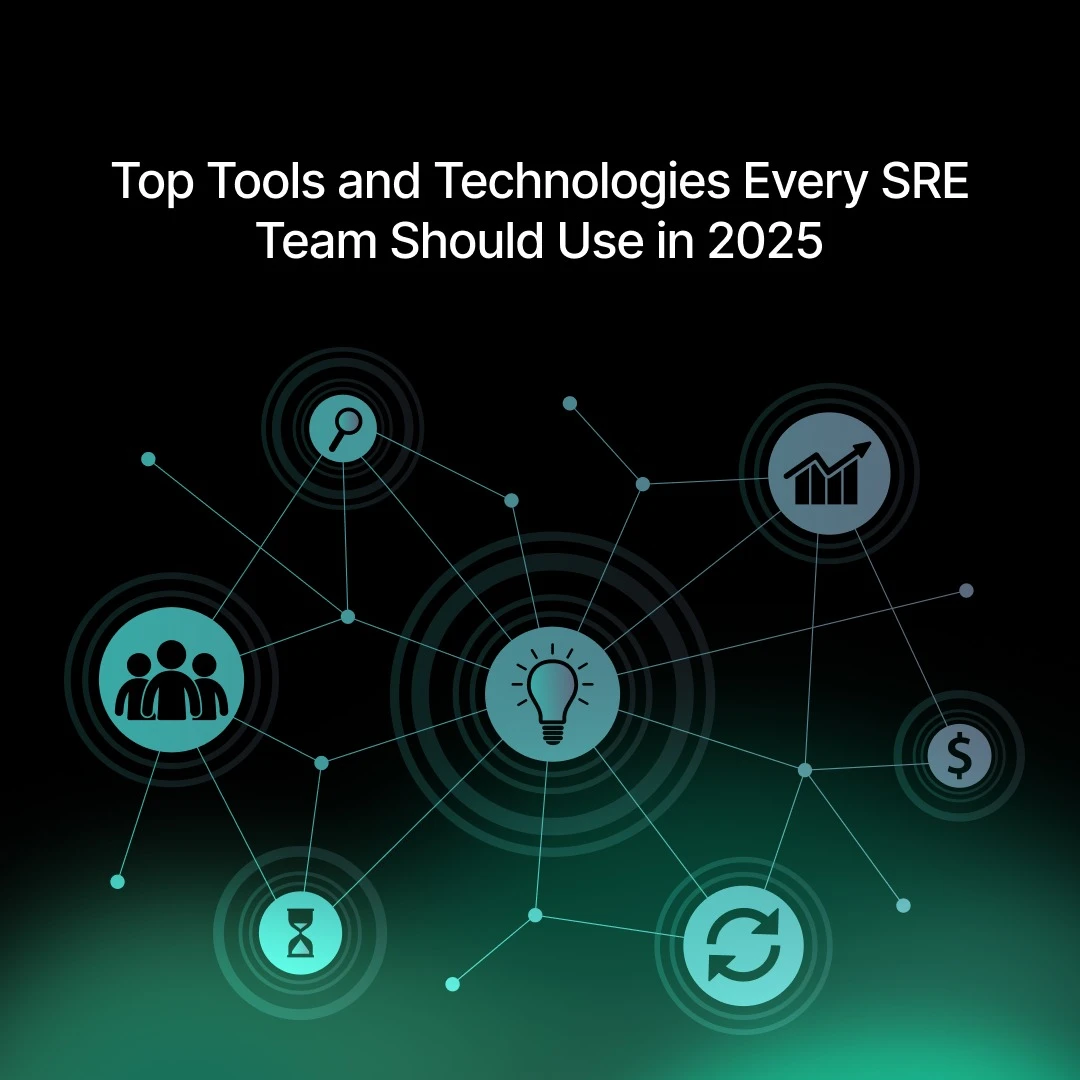
In this article, we will discuss the must-have tools that your Site Reliability Engineering (SRE) team must use in 2026. This guide covers multiple areas such as monitoring, incident handling, infrastructure automation, and cost optimization, thus covering all the needs your team must have to guarantee high availability and deliver great user experiences.
Why Right Tooling is Important in SRE
Site Reliability Engineers must balance development velocity and service reliability. This balance is achieved by using tools that offer end-to-end observability, automate routine tasks, and streamline incident response workflows.
Right tooling assists SRE teams:
- Identify and resolve problems in advance.
- Reduce downtime and enhance SLAs.
- Minimize operational drudgery through automation.
- Monitor and enforce SLIs, SLOs, and error budgets.
- Enhance coordination during incidents and postmortem examinations.
Types of Tools Every SRE Team Must Have
To simplify the selection process, SRE tools may be categorized into the following:
- Monitoring and Observability
- Incident Management and Alerting
- Infrastructure as Code and Automation
- Log Management
- Chaos Engineering
- Cost Optimization and Cloud Visibility
- Collaboration and Documentation
1. Monitoring and Observability Tools
These tools provide visibility into application performance, infrastructure health, and end-user experience. They are critical to SLI measurement and SLO enforcement.
- Prometheus and Grafana – An open-source duo frequently utilized to collect and display metrics. Prometheus gathers time-series metrics, and Grafana offers user-friendly dashboards for real-time analysis.
- Datadog – A one-stop observability platform that collects metrics, logs, and traces. Perfect for cloud-native environments with AWS, Kubernetes, and additional support.
- New Relic – Provides end-to-end visibility from frontend performance to backend infrastructure. Its strength is APM, custom instrumentation, and service maps.
- OpenTelemetry – A vendor-agnostic observability stack to gather traces, logs, and metrics. It provides SRE teams with flexibility regarding monitoring providers.
2. Incident Management and Alerting Tools
They are responsible for timely notification of the appropriate people, who can in turn work to fix problems.
- PagerDuty – Industry-leading incident response software with on-call scheduling, alert routing, and escalation policies. Integrates with most monitoring tools.
- Opsgenie – A member of the Atlassian family, Opsgenie offers flexible alerting, incident tracking, and deep Jira integration, which makes it appropriate for Agile teams.
- FireHydrant – Automates incident handling processes, from incident declarations to executing retrospectives. Offers templated frameworks and timelines.
- Statuspage – Used to inform customers of incident status changes. Helps establish trust by giving visibility during outages.
3. Infrastructure Automation and IaC Tools
Infrastructure as Code (IaC) and automation solutions remove drudgery and normalize cloud infrastructure management.
- Terraform – A declarative IaC offering that is multi-cloud enabled. Facilitates uniform infrastructure provisioning and version control.
- Pulumi – Supports infrastructure definitions in widely used programming languages such as TypeScript, Python, and Go. Suitable for developer-focused teams.
- Ansible – An agentless automation tool that utilizes YAML for deployment, provisioning, and configuration management of applications.
- Jenkins and GitHub Actions – Generally adopted CI/CD tools enable automatic deployment, testing, and infrastructure operations as part of a delivery pipeline.
4. Log Management Tools
Logs are important for debugging, compliance, and incident response. Central logging may allow for quicker root cause analysis.
- ELK Stack (Elasticsearch, Logstash, Kibana) – An open-source system for displaying, storing, and presenting logs. Highly customizable and scalable.
- Fluentd and Fluent Bit – Lightweight log forwarders are typically used in Kubernetes environments. They are ELK, Loki, and other cloud-native log storage solution-compatible.
- Splunk – An enterprise-grade platform for log management and security analytics. Offers advanced search capabilities and machine learning insights.
- Grafana Loki – A scalable log collection system natively integrated with Grafana dashboards. Perfect for Kubernetes-native observability.
5. Chaos Engineering Tools
These tools insert controlled failures to test system resilience and determine single points of failure before they become real problems.
- Gremlin – Provides secure and safe chaos experiments for reliability testing under different failure modes. Provides scheduling and control of blast radius.
- Chaos Mesh – A cloud-native chaos testing platform designed for Kubernetes. Provides declarative chaos workflows based on custom resource definitions.
- LitmusChaos – A hosted open-source chaos engineering platform operated by CNCF. Offers integrations into observability platforms and CI/CD pipelines.
6. Cost Optimization and Cloud Visibility Tools
SREs must consider not only reliability but also operational effectiveness. Such tools allow for monitoring of cloud usage and cost optimization.
- AWS Trusted Advisor and AWS Cost Explorer – In-built AWS features to scan cloud usage, detect idle resources, and get recommendations on how to optimize.
- Kubecost – Built for Kubernetes, it monitors costs by namespace, deployment, or workload. It helps to accurately charge cloud costs to projects or teams.
- CloudHealth by VMware – Provides insights into multi-cloud environments and offers cost, performance, and compliance governance capabilities.
- Finout – Streamlines FinOps by consolidating cloud and SaaS expense into one dashboard. Easy to charge back to business units or customers.
7. Collaboration and Documentation Tools
Successful incident response and knowledge sharing demand streamlined cooperation and easily accessible documentation.
- Confluence and Notion – Function as centralized libraries to record runbooks, SOPs, postmortems, and architecture decisions.
- Slack and Microsoft Teams – Facilitate emergency communication in operations. Integration between monitoring and event alerting offers enhanced awareness surrounding situations.
- Jira and Linear – Project management software used to monitor SLO violation-related work, reliability problems, and technical debt due to incident-related work.
How to Select the Proper SRE Tool Stack
Choosing the right toolset isn't a matter of features; it's about fit. Use the following guidelines:
- Integration with your existing ecosystem
- Scalability and performance under load
- Ease of use and familiarity of teams
- Open-source vs. commercial support
- The ownership and licensing cost
At SquareOps, we help companies analyze, implement, and optimize their SRE tooling against real business needs. Whether you're running Kubernetes at scale or rearchitecting legacy applications, the right stack is important.
Conclusion
In today's culture of rapid software release, reliability cannot be an afterthought but needs to be designed into the system from the ground up. That is where Site Reliability Engineering (SRE) teams, well-armed with technology and tools, come into the picture.
Need assistance choosing, setting up, or utilizing your SRE tools? SquareOps offers full-stack Site Reliability Engineering services, including observability configuration, 24/7 incident handling, and cloud optimization.
Contact us today to establish or expand your SRE team with experienced expertise and combat-proven solutions.
