What is Monitoring & Observability?
To maintain system reliability in cloud environments, organizations need a strong monitoring and observability framework in place. Our solution provides real-time visibility into your cloud infrastructure and applications, enabling teams to quickly detect and respond to issues before they impact your users. Combined with our 24x7 SRE services, we ensure your systems remain highly available.
Observability extends beyond basic monitoring by providing deep insights into the behavior of your applications and services, facilitating more effective troubleshooting. Learn more about observability in modern microservices architecture.
Benefits of Monitoring and Observability
Implementing a robust monitoring and observability strategy delivers significant advantages for your cloud infrastructure and applications.
Early Detection
Identifies performance bottlenecks before escalation, allowing timely interventions that enhance stability.
Service Reliability
Ensures continuous availability through proactive monitoring, minimizing disruptions and maintaining user trust.
Faster Troubleshooting
Quickly diagnoses issues with detailed logs and traces, reducing downtime and improving efficiency.
Incident Response
Streamlines incident management for rapid resolution with minimal operational impact.
Improved Security
Integrates security measures into monitoring practices, protecting applications and data from threats. Complements our cloud security services.
Customer Experience
Addresses issues proactively, leading to higher satisfaction and user loyalty.
Key Components We Implement
Infrastructure Monitoring
Tracking resource usage, network performance, and system availability to identify potential issues before they impact operations. Works seamlessly with cloud-native architectures.
What We Deliver
Real-time health metrics, capacity planning, and automated alerts for your cloud infrastructure.
Application Performance Monitoring
Monitoring application metrics and response times to detect performance bottlenecks and ensure optimal user experiences. Integrates with our CI/CD pipelines.
What We Deliver
End-to-end APM with request tracing, latency analysis, and performance optimization recommendations.
Security Monitoring
Continuous oversight of security events and anomalies within your applications and infrastructure.
What We Deliver
Threat detection, anomaly alerts, and security incident dashboards for rapid response.
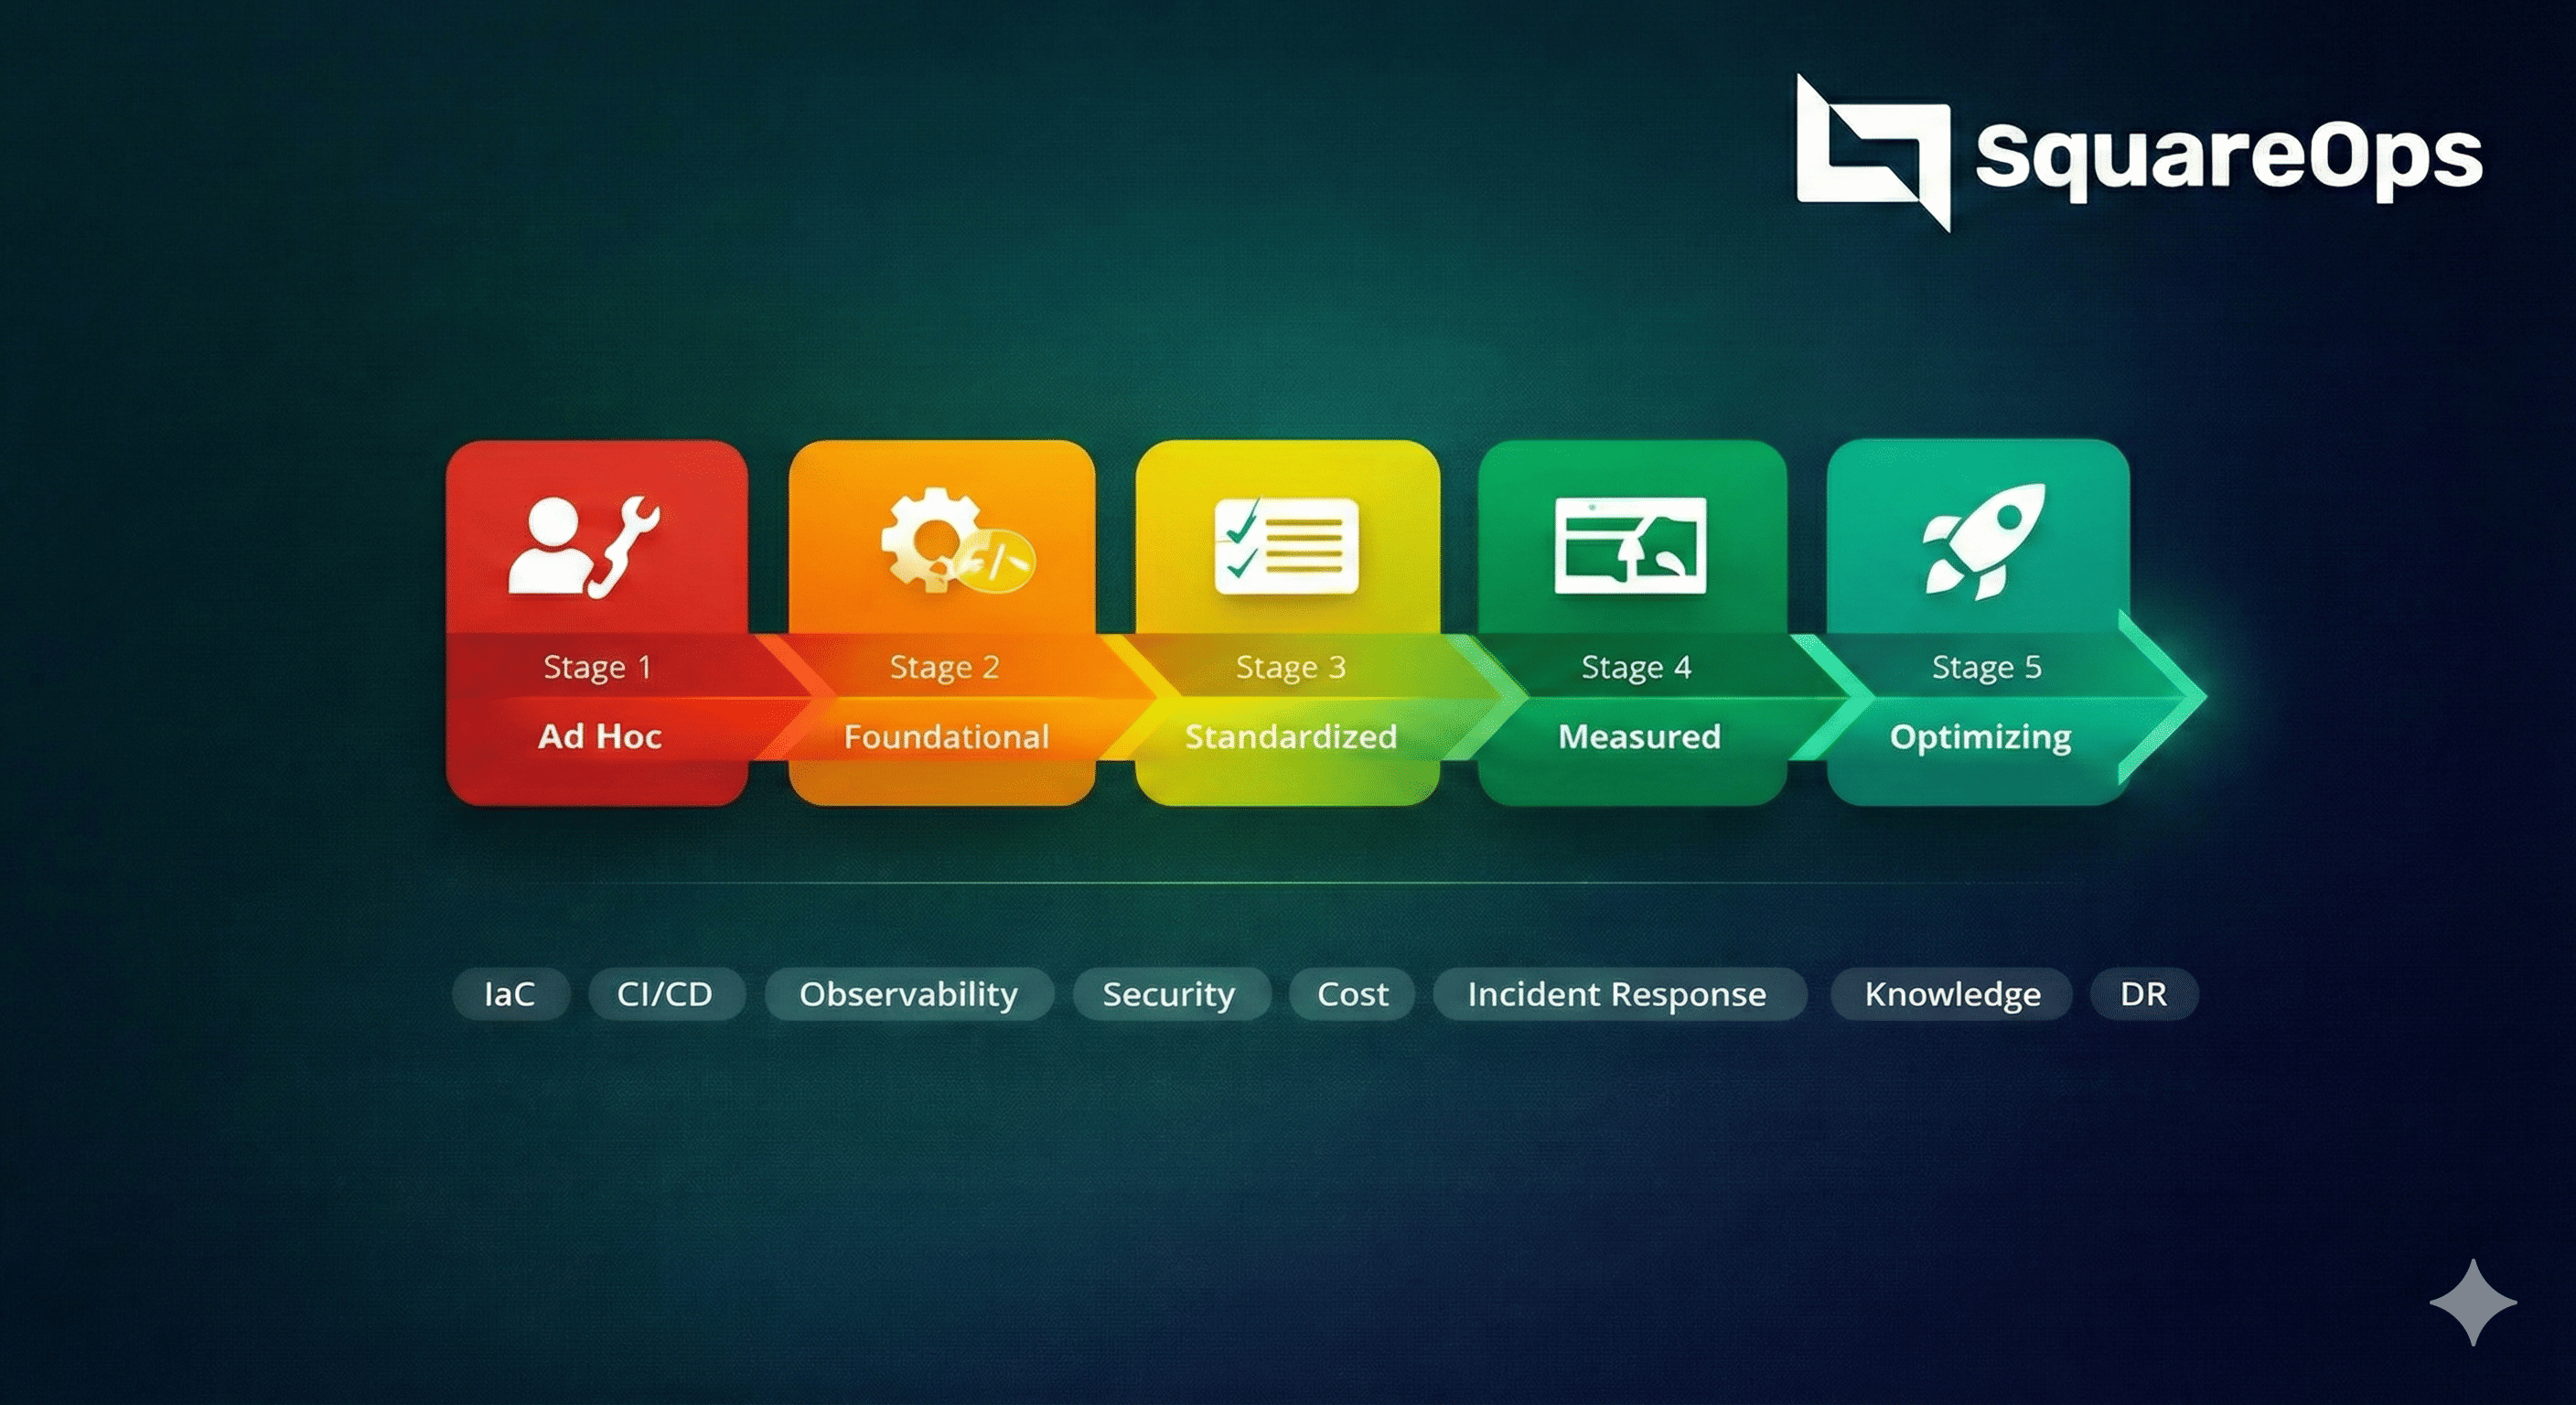
The Observability Journey
Our comprehensive approach ensures your monitoring and observability stack is tailored to your specific needs and scales with your business.
From initial assessment to continuous optimization, SquareOps delivers end-to-end observability solutions that provide actionable insights and drive operational excellence.
Tracing and Telemetry
Insights into the flow of requests through your applications, providing visibility into interactions between components to troubleshoot performance issues.
Log Management
Centralized log aggregation and analysis for root-cause analysis, auditing, and real-time issue tracking across your entire stack.
Dashboards and Analytics
Visualizes data collected from various sources, enabling teams to analyze trends, monitor KPIs, and make informed decisions based on real-time information.
Alerting and Notifications
Automated alerts based on predefined thresholds and conditions, ensuring that the right teams are notified promptly for quick remediation.
Continuous Optimization
Ongoing refinement of monitoring strategies, alert thresholds, and dashboards to ensure your observability stack evolves with your infrastructure.
Optimize cloud performance with proactive monitoring
Get real-time visibility into your infrastructure.
Get StartedObservability Stack Options: Choose Your Tools
We help you implement the right observability tools based on your infrastructure needs, scale, and budget. Here are the technology paths we specialize in:
Prometheus & Grafana
Industry-standard open-source stack for metrics collection, alerting, and visualization. Deploy using our Terraform modules.
ELK Stack (Elasticsearch, Logstash, Kibana)
Comprehensive log management solution for centralized logging, search, and analysis across distributed systems.
Cloud-Native Monitoring
Leverage AWS CloudWatch, Azure Monitor, or GCP Operations Suite for seamless integration with your cloud infrastructure.
Distributed Tracing
Implement Jaeger, Zipkin, or OpenTelemetry for end-to-end request tracing across microservices on Kubernetes.
AIOps & Intelligent Alerting
Advanced alerting with PagerDuty, Opsgenie, or custom ML-based anomaly detection to reduce alert fatigue.