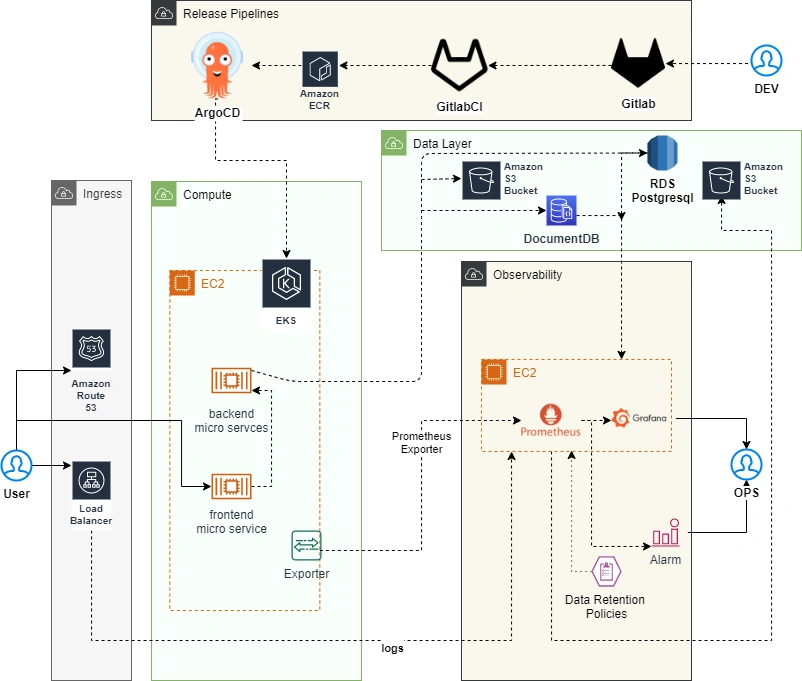
The entire Network Topology of the deployment was designed
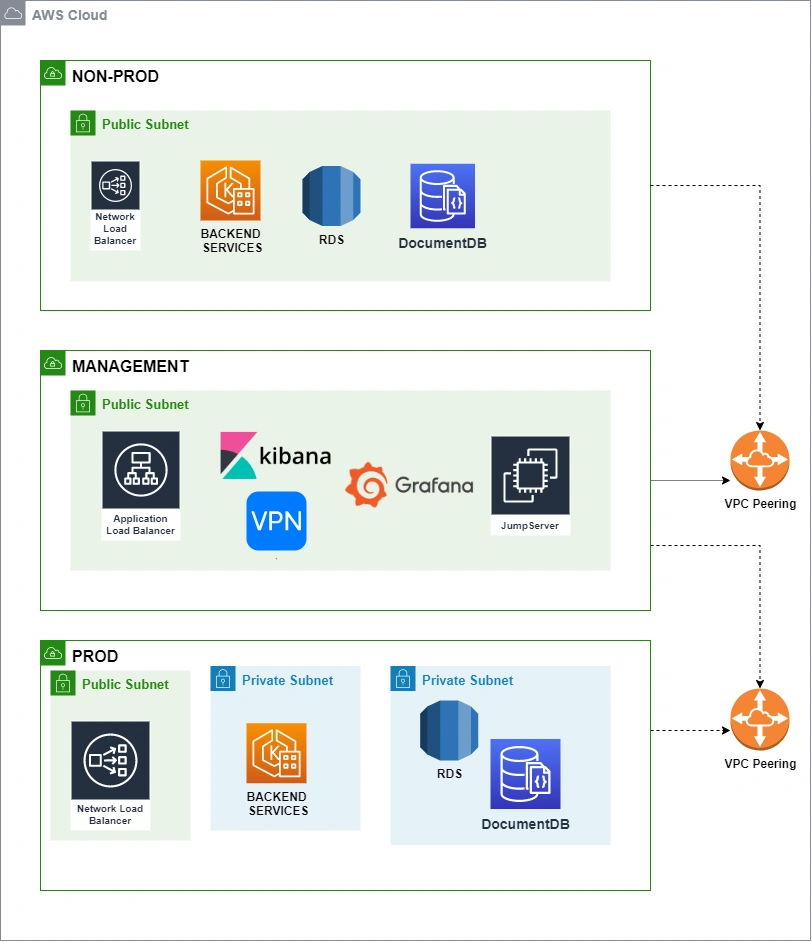
Ingress Layer
- Load Balancer: A network load balancer will be used for load balancing. It’s being used because it is faster than an application load balancer.
- Route53: It is a DNS hosting solution provided by AWS.
Compute Layer
- Amplify: It is a service provided by AWS to host the frontend which is fully managed by AWS and provides inbuilt CDN.
- EKS: It stands for Elastic Kubernetes Service, a managed Kubernetes service that is provided by AWS. All the backend services will be hosted here.
Data Layer
- RDS: Relational Database Service will be used for storing Postgres data.
- DocumentDB: It will be used for storing NoSQL data, it is a MongoDB compatible database.
- S3: It is used to store logs for some content related to applications like files and images.
Observability Layer
- Prometheus: Prometheus is an open-source system monitoring and alerting toolkit.
- Grafana: Grafana is multi-platform open-source analytics and interactive visualization web application. It provides charts, graphs, and alerts for the web when connected to supported data sources.
Logging
- ELK will be used for logging. “ELK” is the acronym for three open source projects: Elasticsearch, Logstash, and Kibana.
- Elasticsearch is a search and analytics engine. Logstash is a server‐side data processing pipeline that ingests data from multiple sources simultaneously, transforms it, and then sends it to a “stash” like Elasticsearch. Kibana lets users visualize data with charts and graphs in Elasticsearch.
Architectural Presentation
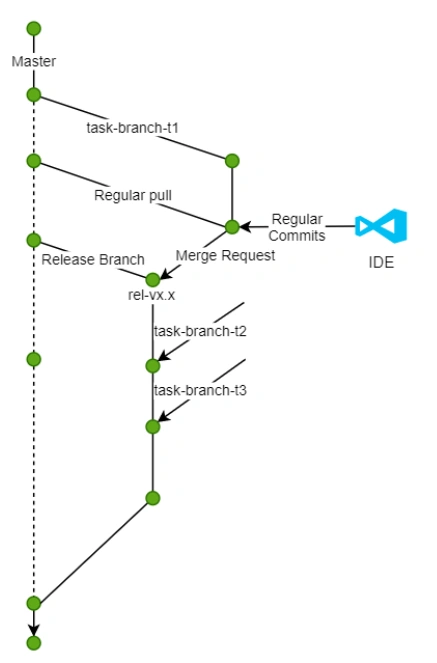
8. CI/CD Workflow