Why Cloud Costs Spike After Migration — The First 90 Days
You completed the migration. The workloads are running. The champagne bottle is empty. Then the first cloud bill arrives — and it is 15-30% higher than anyone projected. This is not an anomaly. It is the norm.
According to Flexera's 2026 State of the Cloud report, organizations waste 30-50% of their cloud spend in the months following migration. A separate Crayon survey found that 94% of IT leaders report struggling with cloud cost management within the first year post-migration. The pattern is so consistent that it has a name in FinOps circles: the post-migration cost spike.
Three forces drive this spike:
- Over-provisioned resources carried from on-premises sizing. When teams migrate VMs and databases, they typically match or exceed their on-premises specifications. A server that ran at 12% CPU utilization on-premises becomes an equally oversized — and far more expensive — cloud instance. Unlike on-premises hardware where you already own the capacity, cloud billing is usage-based, so every idle core and unused GB of RAM costs real money every hour.
- Parallel running costs during transition. Most cloud migration strategies involve running on-premises and cloud environments simultaneously for weeks or months. During this overlap period, you are paying for both environments while your workloads may only be actively serving traffic from one.
- Lack of cloud-native cost controls. On-premises environments have a natural spending ceiling — you cannot spend more than the hardware you purchased. Cloud environments have no such ceiling. Without proactive budget alerts, tagging strategies, and commitment-based discounts, costs grow unchecked. Teams accustomed to on-prem procurement cycles often lack the muscle memory for continuous cloud cost governance.
The good news: this spike is predictable, and it is fixable. Organizations that implement a structured cloud cost management framework within the first 90 days post-migration consistently reduce waste by 30-50% within 12-18 months. The framework that follows is the one we use at SquareOps with our clients — tested across hundreds of migrations on AWS, Azure, and GCP.
The Post-Migration Cost Governance Framework
Effective post-migration cost optimization is not a one-time cleanup exercise. It is a continuous governance practice built on four pillars, each dependent on the one before it:
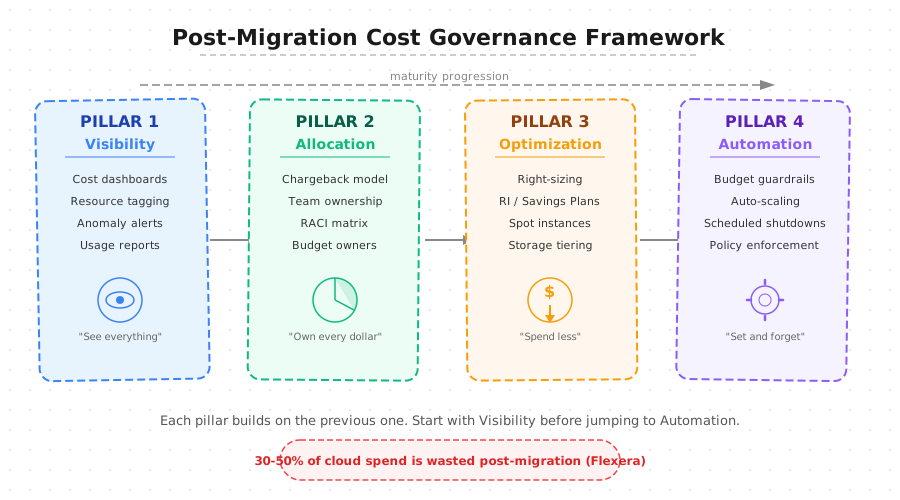
- Visibility — You cannot optimize what you cannot see. This pillar establishes dashboards, tagging taxonomies, anomaly detection, and real-time cost alerts so every dollar of cloud spend is attributed and visible.
- Allocation — Once costs are visible, you assign ownership. Chargeback and showback models ensure that the teams consuming resources are accountable for the costs they generate.
- Optimization — With visibility and accountability in place, you can act. Right-sizing, commitment discounts, storage tiering, and Kubernetes resource tuning deliver the bulk of direct savings.
- Automation — Manual optimization does not scale. Budget guardrails, auto-scaling policies, scheduled shutdowns, and Infrastructure as Code cost estimation make cost governance continuous and self-enforcing.
Each pillar builds on the previous. Attempting to automate cost controls (Pillar 4) before establishing visibility (Pillar 1) leads to misconfigured alerts, false positives, and governance fatigue. The framework is sequential by design.
Pillar 1 — Cost Visibility and Tagging Strategy
Visibility is the foundation. Without it, cost conversations devolve into finger-pointing and guesswork. Every cloud provider offers native cost management tools — AWS Cost Explorer, Azure Cost Management + Billing, and GCP Cloud Billing Reports — but their value depends entirely on the quality of your resource tagging.
Mandatory Tagging Taxonomy
Tagging is the single most impactful action you can take in the first week post-migration. Every resource — every EC2 instance, every S3 bucket, every RDS database — must carry a consistent set of tags. Without tags, your cost dashboard is a wall of unattributed numbers.
| Tag Name | Example Values | Purpose |
|---|---|---|
Environment | production, staging, development, sandbox | Separate prod costs from non-prod; identify shutdown candidates |
Team | platform-engineering, data-science, backend, marketing | Enable team-level chargeback and ownership accountability |
Application | payment-service, recommendation-engine, user-api | Attribute costs to specific services for unit economics |
CostCenter | CC-4200, CC-5100, CC-3300 | Map cloud costs to finance department budget codes |
Owner | jane.doe@company.com, platform-team | Identify who to contact for cost anomalies or right-sizing |
ExpiryDate | 2026-09-30, 2026-12-31 | Flag temporary resources for automated cleanup |
AutomationEligible | true, false | Mark resources safe for automated shutdown/right-sizing |
Enforcement is non-negotiable. Use AWS Service Control Policies (SCPs), Azure Policy, or GCP Organization Policies to prevent resource creation without mandatory tags. At minimum, the first five tags in the table above should be required. Any untagged resource that slips through should trigger an automated alert within 24 hours.
Anomaly Detection and Real-Time Alerts
Configure cost anomaly detection from day one. AWS Cost Anomaly Detection, Azure Cost Alerts, and GCP Budget Alerts all support threshold-based and ML-based anomaly detection. Set up alerts at three levels:
- 80% of monthly budget — early warning to investigate trends
- 100% of monthly budget — immediate review required
- 120% of monthly budget — escalation to leadership; potential hard stop on non-critical provisioning
Route alerts to both the owning team (via Slack or PagerDuty) and the FinOps team. Alerts that go to a shared inbox die quietly. Alerts that page the team responsible for the spend get addressed. Integrating these alerts with your monitoring and observability stack ensures cost signals sit alongside performance and reliability signals — where engineers already look.
Pillar 2 — Cost Allocation and Accountability
Visibility without accountability is a dashboard nobody looks at. The second pillar assigns financial ownership to the teams that consume cloud resources, creating a direct feedback loop between architecture decisions and cost outcomes.
Chargeback vs. Showback Models
| Model | How It Works | Best For | Risk |
|---|---|---|---|
| Showback | Teams see their costs in dashboards and reports, but costs are not deducted from their departmental budget | Organizations new to FinOps; teams that need a learning period to understand cloud cost drivers | Lower urgency to act — visibility without consequences can be ignored |
| Chargeback | Cloud costs are directly billed to the consuming team's departmental budget, affecting their P&L | Mature organizations with established tagging and cost attribution; teams with budget authority | Can create friction; teams may game the system or resist adoption without executive sponsorship |
| Hybrid | Showback for shared services (networking, security, platform); chargeback for team-owned compute and storage | Most mid-to-large organizations; balances accountability with pragmatism for shared infrastructure | Requires clear ownership boundaries and a fair model for allocating shared costs |
For most organizations in the first 6 months post-migration, we recommend starting with showback to build cost literacy, then transitioning to a hybrid model by month 6-12 once tagging coverage exceeds 90% and teams have established baseline cost benchmarks.
Monthly Cost Review Cadence
Establish a monthly cloud cost review meeting with a fixed attendee list and agenda. This is not optional. Without a recurring cadence, cost optimization degrades within weeks. The meeting should include:
- Month-over-month cost trends by team, application, and environment
- Top 5 cost drivers and their trajectory
- Anomalies detected and resolved
- Right-sizing and commitment discount opportunities identified
- Action items with owners and deadlines from the previous review
Assign a RACI matrix for cost decisions: the FinOps team is Responsible for surfacing data and recommendations, engineering leads are Accountable for acting on right-sizing recommendations, finance is Consulted on commitment purchases, and leadership is Informed on monthly spend trends. Without clear ownership, cost optimization becomes everyone's problem and nobody's priority.
Pillar 3 — Right-Sizing and Resource Optimization
This is where the direct savings materialize. With visibility and accountability established, you can systematically identify and eliminate waste. Right-sizing alone typically recovers 20-35% of compute spend within the first 90 days of active optimization.
Right-Sizing Methodology
Right-sizing is the process of matching instance types and sizes to actual workload requirements. The methodology is straightforward:
- Collect 14 days of metrics — CPU utilization, memory usage, network I/O, and disk IOPS. Less than 14 days risks missing weekly traffic patterns.
- Identify candidates — Any instance averaging below 40% CPU and 60% memory utilization over the 14-day window is a right-sizing candidate.
- Model the target — Use AWS Compute Optimizer, Azure Advisor, or GCP Recommender to get instance-family recommendations. Always validate recommendations against peak utilization (p95/p99), not averages.
- Test and migrate — Resize non-production instances first. Monitor for 48-72 hours. If performance metrics hold, apply the same change to production during a maintenance window.
- Repeat quarterly — Workload profiles change. A right-sized instance in Q1 may be over-provisioned by Q3 as traffic patterns shift.
Commitment Discounts — Reserved Instances vs. Savings Plans vs. Spot
Commitment-based discounts are the second largest savings lever after right-sizing. However, buying commitments too early or without sufficient usage data is one of the most expensive mistakes in post-migration cost optimization.
| Discount Type | Commitment | Flexibility | Typical Savings | Best For |
|---|---|---|---|---|
| On-Demand | None | Full — change anytime | 0% (baseline) | Unpredictable workloads, new applications, short-term spikes |
| Compute Savings Plans | 1 or 3 year $/hour | High — any instance family, region, OS, or compute service (EC2, Fargate, Lambda) | 20-30% | Baseline compute across diverse workloads; organizations still refining architecture |
| EC2 Instance Savings Plans | 1 or 3 year $/hour | Medium — locked to instance family in a region, flexible on size, OS, tenancy | 30-40% | Stable workloads with predictable instance family usage |
| Reserved Instances | 1 or 3 year | Low — locked to instance type, region, tenancy, OS | 35-50% | Databases (RDS, ElastiCache, Redshift) with consistent usage patterns |
| Spot Instances | None (can be interrupted) | High — but instances can be reclaimed with 2 min notice | 60-90% | Batch processing, CI/CD pipelines, data processing, fault-tolerant workloads |
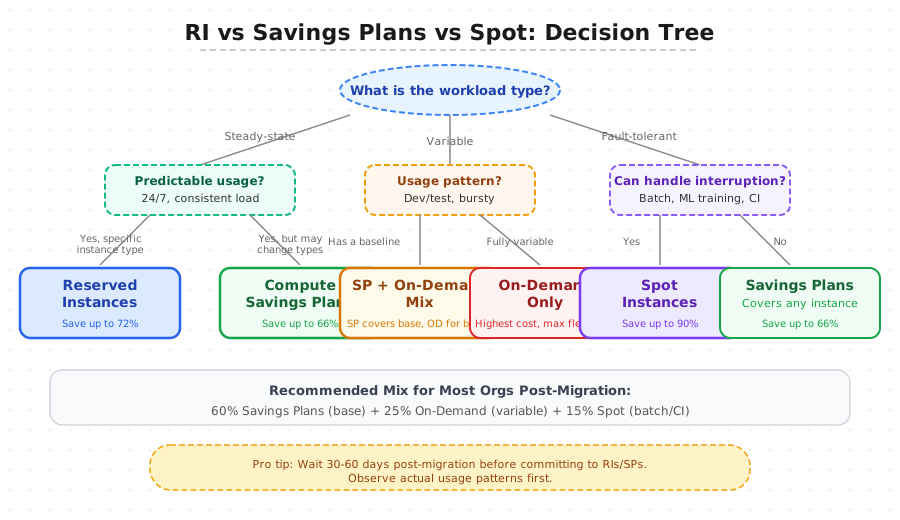
Recommended commitment strategy for post-migration: Wait 30-60 days to collect usage data. Start with Compute Savings Plans covering 60% of your stable baseline. Keep 25% on-demand for variable workloads. Allocate 15% to Spot instances for batch and CI/CD. Purchase Reserved Instances only for databases and caches with proven, stable usage patterns beyond 6 months.
Storage Optimization
Storage is often the quietest cost leak. After migration, teams frequently leave data in expensive tiers long past its access window:
- S3 Lifecycle Policies — Move objects from S3 Standard to S3 Infrequent Access after 30 days, to S3 Glacier after 90 days, and to Glacier Deep Archive after 180 days. This single policy can reduce storage costs by 60-80% for archival data.
- EBS Volume Optimization — Audit for unattached EBS volumes (common post-migration artifact), oversized gp2 volumes that should be gp3 (gp3 is 20% cheaper with better baseline performance), and snapshots older than 90 days without a retention policy.
- Database Storage — Enable RDS storage autoscaling to avoid over-provisioning. Review Aurora storage usage — Aurora charges for allocated storage even if freed space is not released to the cluster.
Kubernetes Cost Optimization
For organizations running Kubernetes clusters post-migration, container cost optimization requires a different approach than VM-level right-sizing:
- Resource requests and limits — Set CPU and memory requests based on actual pod utilization (use Vertical Pod Autoscaler in recommend mode for 7-14 days). Over-requesting resources leads to node waste; under-requesting leads to OOM kills and scheduling failures.
- Karpenter for node provisioning — Replace Cluster Autoscaler with Karpenter on EKS. Karpenter provisions right-sized nodes from a diverse set of instance types (including Spot), reducing node-level waste by 30-50% compared to fixed node groups.
- Namespace-level cost attribution — Use Kubecost or OpenCost to attribute cluster costs to individual namespaces, teams, and applications. Without namespace-level cost visibility, Kubernetes becomes a cost black box.
- Pod disruption budgets and Spot — Run non-critical workloads on Spot nodes with appropriate pod disruption budgets. This is safe for stateless services, workers, and CI/CD agents.
Pillar 4 — Automated Cost Controls and Guardrails
Manual cost optimization is a full-time job that nobody was hired for. The fourth pillar encodes your cost governance policies into automated guardrails that enforce discipline without requiring constant human attention.
Budget Alerts and Hard Limits
Configure AWS Budgets, Azure Budgets, or GCP Budget Alerts with automated actions at each threshold:
- 80% threshold — Send Slack notification to the owning team and FinOps channel. No automated action — this is an awareness trigger.
- 100% threshold — Send email and Slack notification to team lead and engineering manager. Create an automatic Jira ticket for investigation.
- 120% threshold — Escalate to VP Engineering and CTO. Trigger an SCP that blocks new resource creation in non-production accounts (AWS) or apply a deny policy on non-essential resource types (Azure/GCP).
Auto-Scaling Policies
Right-sizing sets the floor; auto-scaling adjusts dynamically. Configure target-tracking auto-scaling policies tied to business-relevant metrics:
- Compute — Scale on CPU utilization (target 65-75%), request count, or custom application metrics (queue depth, active connections).
- Containers — Use Horizontal Pod Autoscaler with KEDA for event-driven scaling. Scale to zero for non-production workloads during off-hours.
- Databases — Enable Aurora Auto Scaling for read replicas. Use DynamoDB auto-scaling or on-demand capacity mode for unpredictable traffic.
Scheduled Shutdowns for Non-Production
Non-production environments (development, staging, QA) typically run 24/7 but are used only during business hours. Scheduling automatic shutdowns for evenings and weekends reduces non-production compute costs by 65-75%:
- Shut down development environments from 8 PM to 8 AM local time on weekdays
- Shut down all non-production environments on weekends
- Use AWS Instance Scheduler, Azure Automation, or custom Lambda/Cloud Functions
- Tag resources with
AutomationEligible=trueto opt in; never auto-shutdown untagged production resources
Infrastructure as Code Cost Estimation
Shift cost awareness left — into the infrastructure planning stage. Tools like Infracost integrate with Terraform and Pulumi to estimate the cost impact of infrastructure changes before they are applied:
- Add Infracost to CI/CD pipelines to comment cost estimates on every pull request that modifies infrastructure
- Set cost thresholds that require approval — any change that increases monthly costs by more than $500 requires FinOps team review
- Track infrastructure cost trends over time to identify drift between estimated and actual spend
This practice prevents cost surprises at deployment time and builds cost literacy across engineering teams. When developers see the dollar impact of choosing an r6i.4xlarge over an r6i.2xlarge in their pull request, they make better sizing decisions.
Common Post-Migration Cost Mistakes and How to Fix Them
After working with organizations across industries on post-migration cost optimization, these are the seven mistakes we see most frequently — and the specific fixes for each:
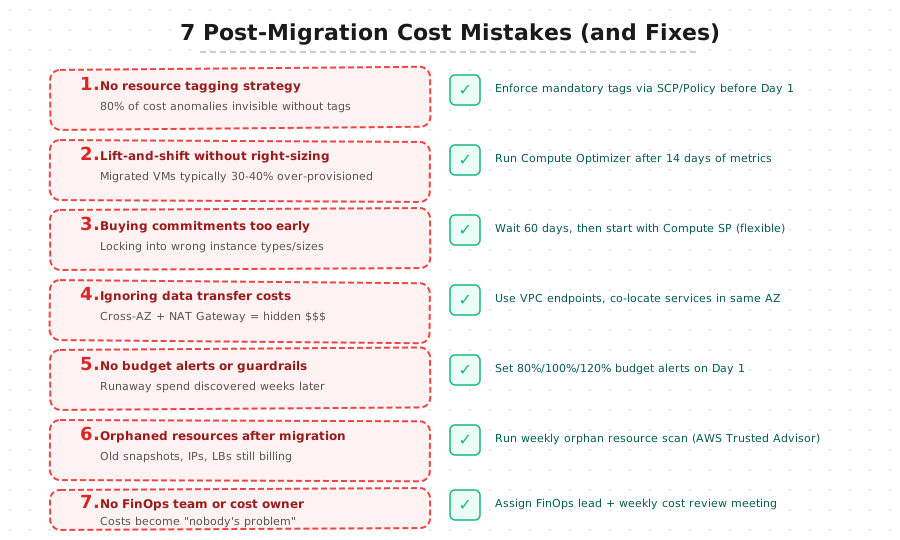
- Lift-and-shift sizing without right-sizing. Teams migrate on-premises specs directly to cloud instances without analyzing actual utilization. Fix: Run a 14-day utilization analysis on every migrated workload within the first 30 days. Resize anything running below 40% average CPU.
- Buying Reserved Instances too early. Eager to capture savings, teams purchase RIs in week one based on pre-migration estimates. Usage patterns change post-migration, leaving 20-40% of RI capacity unused. Fix: Wait 60 days minimum. Start with Compute Savings Plans for flexibility. Only purchase RIs for databases with 6+ months of stable usage data.
- No tagging enforcement. Tags are "recommended" but not required. Within 3 months, 40-60% of resources are untagged and unattributable. Fix: Implement SCPs or Organization Policies that deny resource creation without mandatory tags from day one.
- Orphaned resources accumulating silently. Detached EBS volumes, unused Elastic IPs, idle NAT Gateways, and empty load balancers pile up after migration. A single unused NAT Gateway costs ~$32/month; across hundreds of resources, this becomes significant. Fix: Run a weekly automated orphaned resource report. Use AWS Trusted Advisor, Azure Advisor, or custom scripts to identify and flag resources with zero traffic or connections for 14+ days.
- Running non-production environments 24/7. Development and staging environments run around the clock because nobody configured scheduled shutdowns. Fix: Implement scheduled shutdowns for all non-production environments immediately. This is the lowest-effort, highest-impact optimization — 65-75% cost reduction on non-prod compute with zero architectural change.
- Ignoring data transfer costs. Data transfer charges are the surprise line item on every cloud bill. Cross-AZ traffic, VPC peering data transfer, and egress charges add up quickly, especially for microservices architectures. Fix: Co-locate communicating services in the same AZ where possible. Use VPC endpoints for AWS service communication to avoid NAT Gateway data processing charges. Monitor data transfer costs as a separate budget category.
- No FinOps ownership. Cost optimization is treated as a one-time project rather than an ongoing practice. Without a named FinOps owner (person or team), cost governance degrades within 60-90 days. Fix: Designate a FinOps lead — whether a dedicated role, a shared responsibility within platform engineering, or an embedded function within finance. Establish the monthly cost review cadence and hold it religiously.
Tools for Ongoing Cloud Cost Management
The right tooling accelerates every pillar of cost governance. Here is a comparison of the most effective tools for post-migration cost management, spanning native cloud provider tools and third-party solutions:
| Tool | Type | Best For | Pricing Model |
|---|---|---|---|
| SpendZero | SquareOps Platform | Automated cloud cost optimization with 37+ waste detection checks across 25+ AWS services, one-click remediation, real-time dashboards, cost allocation, and anomaly detection | Free initial scan; platform access included with SquareOps FinOps engagements |
| AWS Cost Explorer | Native (AWS) | AWS cost visualization, filtering by tags/services, historical trends, and RI/SP coverage reports | Free (included with AWS account) |
| AWS Compute Optimizer | Native (AWS) | Right-sizing recommendations for EC2, EBS, Lambda, and ECS based on CloudWatch metrics | Free for basic; Enhanced recommendations at $0.0003272/resource/hour |
| Azure Cost Management | Native (Azure) | Azure cost analysis, budgets, advisor recommendations, and export to Power BI | Free (included with Azure subscription) |
| GCP Cloud Billing Reports | Native (GCP) | GCP spend visualization, budget alerts, BigQuery billing export for custom analytics | Free (included with GCP project) |
| Kubecost / OpenCost | Third-party / CNCF | Kubernetes cost allocation by namespace, deployment, label; idle cost identification; right-sizing recommendations | OpenCost is free and open-source; Kubecost Enterprise starts at $199/cluster/month |
| Infracost | Third-party | Terraform/Pulumi cost estimation in CI/CD; PR-level cost impact comments; policy-based cost guardrails | Free for open-source CLI; Cloud pricing from $50/month for teams |
| CloudHealth (VMware) | Third-party | Multi-cloud cost management, governance policies, RI/SP management, rightsizing across AWS/Azure/GCP | Custom pricing based on cloud spend (typically 1-3% of managed spend) |
| Spot by NetApp | Third-party | Automated Spot instance management, workload-aware instance selection, Kubernetes node optimization (Ocean) | SaaS pricing based on managed compute; varies by usage |
| AWS Trusted Advisor | Native (AWS) | Idle resource detection, security group analysis, service limit checks, cost optimization recommendations | Basic checks free; full checks require Business or Enterprise Support |
| Vantage | Third-party | Multi-cloud cost reporting, per-unit cost tracking, Kubernetes cost reports, provider-level recommendations | Free tier available; Pro from $30/month per connected account |
For most organizations, we recommend starting with SpendZero for automated waste detection and one-click remediation — its free initial scan typically uncovers 28-35% reducible spend within minutes. Pair it with native cloud provider tools for deeper visibility (Cost Explorer or Azure Cost Management), Kubecost or OpenCost for Kubernetes cost attribution, and Infracost for CI/CD cost estimation. Add a multi-cloud management platform like CloudHealth or Vantage when managing spend across two or more cloud providers.
If you are migrating between cloud providers — for example, following an Azure to AWS migration or an AWS to Azure migration — having multi-cloud cost visibility during the transition period is especially critical. Costs will temporarily span both providers, and without unified reporting, you risk losing track of legacy environment spend that should be declining.
Ready to Optimize Your Post-Migration Cloud Costs?
Post-migration cost optimization is not about cutting corners — it is about running your cloud infrastructure efficiently so you can invest savings back into innovation. The organizations that treat cost governance as a first-class engineering practice consistently achieve 18-22% lower TCO than those that treat it as an afterthought.
At SquareOps, our cloud cost management practice has helped organizations reduce post-migration cloud waste by 30-50% using the governance framework outlined in this guide. Whether you are in the first 90 days post-migration or twelve months in and still seeing runaway costs, the framework applies.
Here is what we typically deliver in a cost optimization engagement:
- Complete cloud spend audit with line-item waste identification
- Tagging taxonomy design and automated enforcement
- Right-sizing analysis across all compute, storage, and database resources
- Commitment discount strategy (RI/SP/Spot mix) tailored to your workload patterns
- Automated guardrails including budget alerts, scheduled shutdowns, and IaC cost estimation
- Monthly FinOps review cadence and dashboard setup
If you are looking for expert guidance on post-migration cost optimization — or need AWS consulting support for your cloud infrastructure — get in touch with our team. We will start with a free cost assessment to identify your biggest savings opportunities.