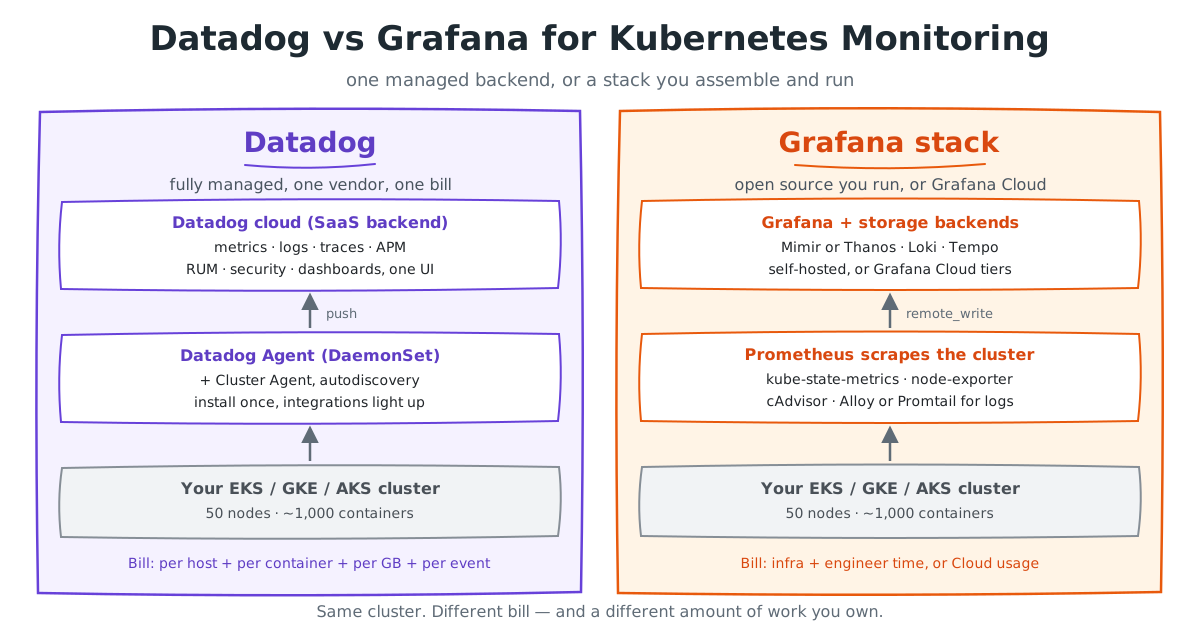
TL;DR: Datadog is fully managed — install the Agent and metrics, logs, traces, APM and security land in one UI the same afternoon — billed per host, per container, per ingested GB and per indexed log event. The Grafana stack (Prometheus, Loki, Tempo, Grafana) is open source you run, or Grafana Cloud usage-based SaaS: far cheaper per node at scale, but you own more operational work. On the 50-node cluster modelled below, Datadog Pro lands near USD 32,900 a year and Grafana Cloud Pro near USD 34,700, while self-hosting costs about USD 15,300 in infrastructure plus 0.25–0.5 of an engineer. The crossover sits between 55 and 155 nodes.
The datadog vs grafana kubernetes question rarely arrives as a technical one. It arrives as a bill, in month four of a cluster that grew faster than anyone planned. This comparison answers it with published 2026 list prices, one concrete cluster, and the line items that decide the outcome.
In this comparison:
- What is the real difference between Datadog and Grafana?
- Side-by-side comparison table
- How each stack runs inside a cluster
- What does Datadog cost for a 50-node cluster in 2026?
- What does the Grafana stack cost for the same cluster?
- Cost comparison at 50 and 250 nodes
- Hidden costs both sides forget
- When is Datadog worth the premium?
- When does the Grafana stack win?
- OpenTelemetry as the portability hedge
- How should you choose?
Not sure which side of the crossover your cluster is on?
SquareOps builds and runs Kubernetes observability on both models — and will tell you when the managed option is genuinely the cheaper answer.
What is the real difference between Datadog and Grafana for Kubernetes?
The comparison is mismatched to start with. Datadog is a product — agents, storage, query engine, dashboards, alerting and APM sold as one thing. Grafana is a visualization layer over data sources you supply. Nobody runs "Grafana" as a monitoring system; they run Prometheus for metrics, Loki for logs, Tempo for traces, and Grafana on top. So there are three options: Datadog (managed SaaS, you install an Agent), Grafana Cloud (the same open-source components run for you, billed on usage), and a self-hosted Grafana stack on your own object storage.
Most articles collapse the last two into "Grafana" and declare it ten times cheaper. The modelling below shows where that breaks: Grafana Cloud at list price tracks Datadog within roughly ten percent. The order-of-magnitude gap appears only when you self-host — and only net of engineer time.
The second difference is data flow. Datadog pushes — an Agent on every node ships to Datadog's backend. Prometheus pulls, discovering targets through the Kubernetes API, which is why every controller, ingress and service mesh you install already exposes a /metrics endpoint that works untouched. For those mechanics, our guide to monitoring Kubernetes metrics with Prometheus and Grafana covers the scrape model, PromQL and dashboard design; this article assumes it and focuses on the choice.
Datadog vs Grafana for Kubernetes: side-by-side comparison
| Dimension | Datadog | Grafana Cloud | Self-hosted Grafana stack |
|---|---|---|---|
| Deployment | Managed SaaS; Agent DaemonSet plus Cluster Agent | Managed Mimir, Loki, Tempo, Grafana; remote_write from your cluster | You run all of it, including object storage and HA |
| Coverage | Metrics, logs, traces, APM, RUM, profiling, security in one product | Metrics, logs, traces, profiles; no bundled RUM-plus-security of the same breadth | Metrics, logs, traces; APM depth follows your instrumentation |
| Setup effort | Hours; autodiscovery needs no per-workload YAML | Hours to days; managed backends, but you choose what to ship | Days to weeks; retention, HA and cardinality control are the real work |
| Dashboards, alerting | Large built-in library; monitors and composite alerts | Grafana unified alerting plus community dashboards | Same, plus an Alertmanager you operate |
| Cost model | Per host, per container above allotment, per GB ingested, per million indexed events, APM per host | Per 1k active series, per GB for logs and traces, plus platform fee | Compute, storage and egress, plus 0.25–0.5 FTE |
| Retention, cardinality | Retention tiers you buy; custom metrics past allotment are contract-priced | 13-month metrics retention on Pro; Adaptive Metrics aggregates unused series | Retention is a storage decision; cardinality control is relabelling you write |
| Vendor lock-in | High on dashboards and query syntax; OTLP reduces instrumentation lock-in | Low — PromQL, LogQL and dashboards port to self-hosted | Lowest; the exit cost is operational, not contractual |
| Best for | Small platform teams needing APM, RUM and security in one pane now | Teams wanting open standards without running storage | Clusters past ~100–150 nodes, or data-residency constraints |
How each stack runs inside a Kubernetes cluster
Datadog deploys as an Agent DaemonSet plus a Cluster Agent, usually via the Datadog Operator or Helm. The Cluster Agent queries the Kubernetes API once for every node instead of each Agent hammering the API server, and autodiscovery reads pod annotations to work out that the pod you just scheduled is Postgres, or NGINX, or Kafka, and starts the right checks. Per Datadog's Kubernetes documentation, one install covers control-plane metrics, kubelet and container metrics, events and logs. Time from kubectl apply to a useful dashboard is minutes.
The Grafana stack normally arrives as kube-prometheus-stack — Prometheus Operator, Prometheus, kube-state-metrics, node-exporter, cAdvisor, Alertmanager and Grafana. Logs flow through Alloy or Promtail into Loki, traces into Tempo, and ServiceMonitor resources declare scrape targets as ordinary Kubernetes objects.
One fact drives cost planning more than any other. Prometheus documentation states that local storage "is not clustered or replicated. Thus, it is not arbitrarily scalable or durable in the face of drive or node outages and should be managed like any other single node database." A single Prometheus is not a long-term store, so any serious deployment adds Thanos or Mimir behind remote_write — the component teams forget when comparing a Prometheus pod against a Datadog invoice. Having that designed once is what our Prometheus and Grafana setup service exists for; node density and log verbosity stay levers you control through managed Kubernetes operations either way.
What does Datadog cost for a 50-node Kubernetes cluster in 2026?
The cluster both sides get priced against: 50 nodes, about 1,000 containers (20 per node with sidecars), 500 GB of logs a month at ~1 KB per event (500 million events), and ~1.5 million raw Prometheus active series before relabelling. Annual commitment pricing, no negotiated discount, one production environment. Rates below are from Datadog's published pricing on Pro.
| Line item | Published rate | Calculation | Monthly |
|---|---|---|---|
| Infrastructure (Pro) | USD 15 per host per month | 50 × 15 | USD 750 |
| Container overage | 5 per host included; USD 0.002 per container-hour beyond | (1,000 − 250) × 0.002 × 730 | USD 1,095 |
| Log ingest | USD 0.10 per ingested GB | 500 × 0.10 | USD 50 |
| Log indexing, 15-day | USD 1.70 per million log events | 500M ÷ 1M × 1.70 | USD 850 |
| Custom metrics above allotment | 100 per host included; overage priced in your contract | 5,000 included; rest contract-specific | Not publicly listed |
| Subtotal (no APM, no custom metrics) | USD 2,745 | ||
| APM (Pro) on every host | USD 31 per host per month with Infrastructure | 50 × 31 | USD 1,550 |
| Total with APM everywhere | USD 4,295 |
That is roughly USD 32,900 a year without APM and USD 51,500 with it. Three lines deserve pulling out.
The container line is bigger than the host line. At 20 containers per node you pay more for container monitoring than for the nodes themselves — the allotment is five per host on Pro, ten on Enterprise, and a normal node passes five before you deploy anything of your own. Model Datadog as "hosts × 15" and you underestimate by half.
Indexing, not ingestion, is the expensive half of logs. Ingest is USD 0.10 per GB; indexing is USD 1.70 per million events at 15-day retention — USD 50 against USD 850 here. The highest-leverage control is not shipping less, it is indexing less: index 20% of events and the monthly total falls to about USD 2,065.
Custom metrics are the line you cannot price in advance. Datadog's custom metrics billing documentation defines one as "a combination of a metric name and tag values (including the host tag)" — one billable unit per unique timeseries — and states that "for each 100 indexed custom metrics over the account allotment, you pay an amount that is specified in your current contract." No list price is published. Pro includes 5,000 here, and one well-tagged histogram forwarded from Prometheus can produce thousands of series alone. Any article quoting a firm overage rate is quoting someone else's contract; get yours in writing.
What does the Grafana stack cost for the same cluster?
Grafana Cloud Pro. Per Grafana's published pricing, Pro carries a USD 19 monthly platform fee, metrics start at USD 6.50 per 1,000 active series with 13-month retention, and logs bill in three parts — USD 0.050 per GB to process, USD 0.400 to write, USD 0.100 to retain, roughly USD 0.55 per GB all-in with 30-day retention — with automatic volume discounts above those entry rates.
Ship the raw 1.5 million series and metrics alone cost 1,500 × USD 6.50 = USD 9,750 a month, about USD 120,500 a year with logs — nearly four times the Datadog bill, and the result most "Grafana is cheaper" comparisons never show. Apply relabelling plus Adaptive Metrics, which Grafana Labs describes as aggregating unused and partially used metrics into lower-cardinality versions of themselves, and a tuned 400,000 billable series gives USD 2,600 a month for metrics, USD 275 for logs and the USD 19 fee — about USD 34,700 a year, within six percent of the equivalent Datadog configuration. That is uncomfortable for both marketing departments: on managed platforms, cardinality discipline moves your bill far more than vendor choice does.
Self-hosted. Run it yourself — Prometheus with Mimir or Thanos behind remote_write, Loki, Grafana, Alertmanager. A defensible shape is three 8 vCPU / 32 GiB instances for metrics and two 4 vCPU / 16 GiB for logs. At AWS published on-demand rates in us-east-1 (m6i.2xlarge USD 0.384/hour, m6i.xlarge USD 0.192), that is USD 841 plus USD 280 a month, plus roughly USD 150 for block storage, object storage and transfer — about USD 1,271 a month, USD 15,300 a year, before committed-use discounts.
Storage is smaller than expected. Applying the Prometheus sizing formula — retention_time_seconds × ingested_samples_per_second × bytes_per_sample at the documented 1–2 bytes per sample — 1.5 million series scraped every 30 seconds is 50,000 samples per second, about 6.5 GB a day, or 2.5 TB for thirteen months of object storage: a rounding error next to compute at S3 Standard rates.
The real number is the one AWS never invoices: 0.25 to 0.5 of an engineer, permanently, plus four to eight weeks to build it properly. Upgrades, cardinality regressions, a Prometheus that OOMs after someone adds a label, and being paged for the monitoring system itself all land there. An engineer at USD 60,000 fully loaded makes self-hosting decisively cheapest at this size; the same 0.35 FTE at USD 200,000 makes it the most expensive option here.
Datadog vs Grafana cost comparison at 50 and 250 nodes
| Option | 50 nodes / ~1,000 containers | 250 nodes / ~5,000 containers |
|---|---|---|
| Datadog Pro — infra, containers, logs | ~USD 32,900 | ~USD 164,700 |
| Datadog Pro + APM on every host | ~USD 51,500 | ~USD 257,700 |
| Grafana Cloud Pro — untuned cardinality | ~USD 120,500 | ~USD 600,000+ |
| Grafana Cloud Pro — tuned cardinality | ~USD 34,700 | ~USD 172,700 |
| Self-hosted — infrastructure only | ~USD 15,300 | ~USD 47,000 |
| Self-hosted + 0.35 FTE at USD 60k loaded | ~USD 36,300 | ~USD 68,000 |
| Self-hosted + 0.35 FTE at USD 200k loaded | ~USD 85,300 | ~USD 117,000 |
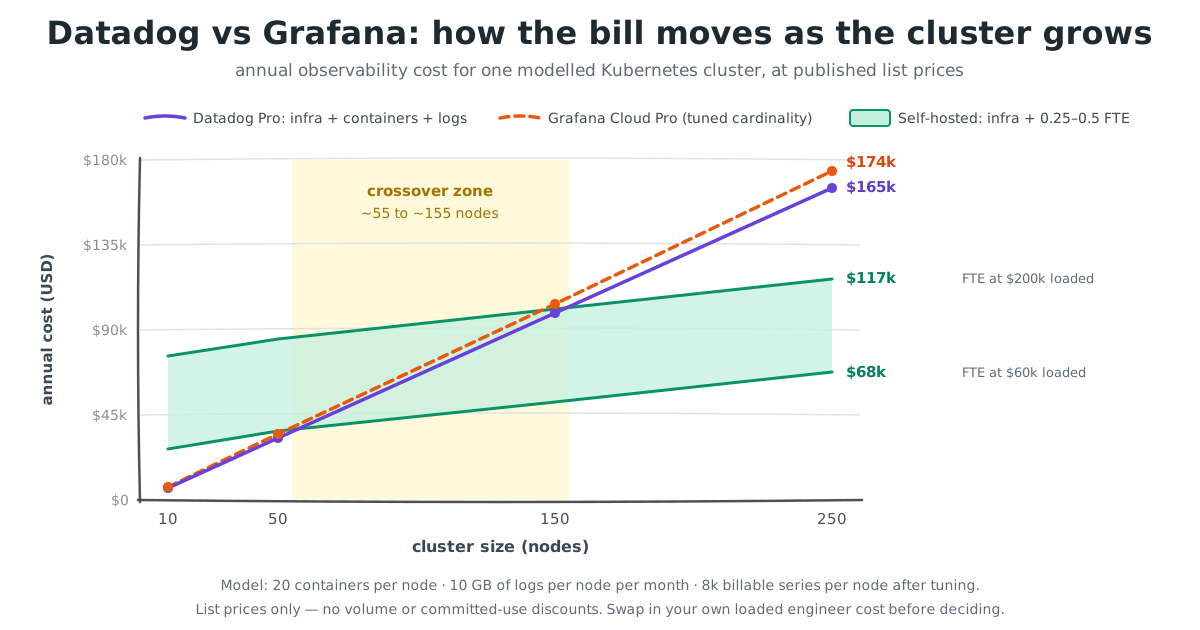
Both SaaS options scale linearly — five times the nodes, five times the bill. Self-hosted infrastructure scales sub-linearly, because a Mimir cluster sized for 1.5 million series does not need five times the hardware for 7.5 million, and the engineering effort barely moves once built. Five times the cluster costs Datadog 5.0x and self-hosting roughly 1.9x.
So there is a crossover, not a winner. With an engineer at a lower loaded cost — an offshore team, or a provider amortising one specialist across clients — self-hosting overtakes both SaaS options at around 55 nodes. With a senior engineer on a US package it moves out to roughly 155 nodes. Below your crossover, paying Datadog is rational and the case for migrating is simply wrong. Above it, the gap compounds every quarter.
Want this modelled against your actual usage?
Bring your Datadog invoice or Prometheus cardinality report and SquareOps will produce a like-for-like comparison, including migration cost if one is warranted.
The hidden costs both sides forget to budget for
Grafana Labs' 2025 Observability Survey of 1,255 practitioners found observability averaging 17% of total compute infrastructure spend, with 74% naming cost the top tool-selection criterion and 37% saying it simply costs too much. Four mechanisms produce that.
- Cardinality, on every platform. One label with a per-pod or per-request value multiplies series without changing a single dashboard — the largest uncontrolled variable in both Datadog custom metrics and Grafana Cloud active series, and the reason the untuned row above is four times the tuned one.
- On-demand versus committed rates. Every Datadog figure here assumes annual commitment. On-demand infrastructure is USD 18 per host rather than 15, and on-demand log indexing USD 2.55 per million events rather than 1.70 — a 20% to 50% premium on identical usage.
- Who gets paged when monitoring breaks. Self-hosting makes the observability stack a production service with its own on-call; skipping this produces a Prometheus nobody owns. That is ordinary site reliability engineering work, and if you lack round-the-clock coverage, an honest comparison adds it.
- Cluster shape and alert quality. Because Datadog bills per host and per container, consolidating onto fewer, larger nodes cuts the observability bill too — making Kubernetes cost optimization the same project. Neither platform saves you from alert fatigue, the survey's leading impediment to incident response; our write-up on reducing MTTR with AI-assisted incident response covers what moves that number, and the wider SRE tooling landscape puts both in context.
When is Datadog worth the premium?
- Your platform team is small. Under three infrastructure engineers, the 0.25–0.5 FTE self-hosting consumes is 10–17% of total capacity, spent on plumbing.
- You need APM, RUM and security in one pane now. Equivalent breadth means Tempo plus a RUM tool plus Falco plus glue. Datadog's integration is the product.
- Your cluster is below the crossover. At 20–50 nodes the SaaS premium is a few thousand dollars a year, less than one engineer-month. Migrating to save it destroys value.
- You have no appetite to run storage. Mimir and Loki are distributed databases, and "nobody here wants to own one" is a legitimate answer.
- Onboarding speed is the constraint. Autodiscovery monitors new workloads the moment they schedule, with no manifest to write.
When does the Grafana stack win on Kubernetes?
- Past roughly 100–150 nodes. Beyond the crossover the linear SaaS curve pulls away from the sub-linear self-hosted one, permanently.
- You already have Prometheus. Most clusters do; adding Datadog on top means paying twice for metrics you already collect.
- Data residency or egress constraints. If logs cannot leave a region or VPC, self-hosting is a requirement — and continuous egress of hundreds of GB a month is a real line item.
- Retention on your terms. It becomes an object-storage decision in cents per GB rather than a pricing tier you buy.
- Portability matters. PromQL, LogQL and dashboards move between Grafana Cloud and self-hosted through configuration, so you can start managed and bring it in-house at the crossover.
Most teams land in the middle: metrics self-hosted where volume is high and value per byte is low, traces or RUM bought where building costs most. Getting that split right is the work behind our Prometheus and Grafana consulting; for the wider shortlist, see our overview of cloud application monitoring tools.
OpenTelemetry as the portability hedge
Whichever way you decide, instrument with OpenTelemetry. The CNCF graduated OpenTelemetry in May 2026, and the 2025 CNCF Annual Survey — the same one putting Kubernetes production use at 82% of container users — records it as the second-highest-velocity CNCF project with more than 24,000 contributors.
Both platforms accept OTLP, so if your services emit OpenTelemetry through a Collector, changing backends becomes an exporter configuration change rather than a re-instrumentation project. It does not make the options equivalent — dashboards, alert definitions and query syntax still have to be rebuilt — but it converts the decision from irreversible to expensive-but-reversible. Do it on day one.
How should you choose between Datadog and Grafana for Kubernetes?
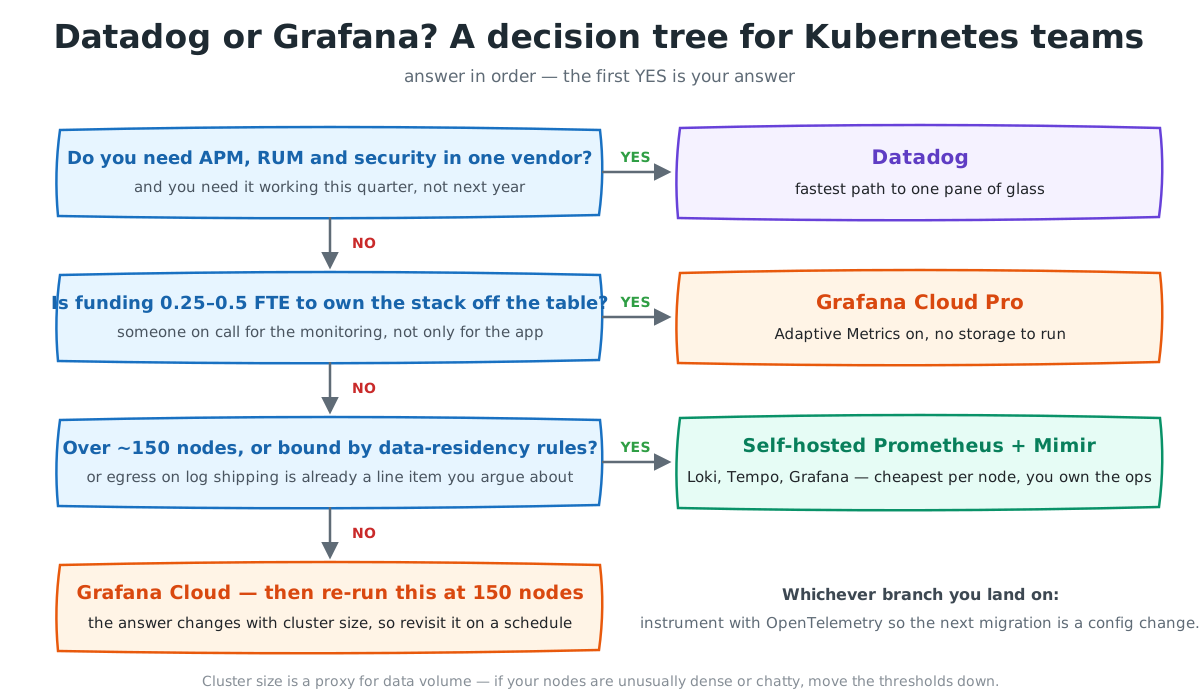
Answer in order and stop at the first yes.
- Do you need APM, RUM and security from one vendor, this quarter? Buy Datadog and revisit in a year. Nothing in the open-source stack assembles that fast.
- Is funding 0.25–0.5 FTE to own the stack off the table? Choose Grafana Cloud Pro with Adaptive Metrics enabled — open standards, portable queries, no storage to run.
- Are you past roughly 150 nodes, or bound by data-residency rules? Self-host Prometheus with Mimir or Thanos, Loki, Tempo and Grafana. The economics are decisive at that scale.
- Otherwise: Grafana Cloud today, and re-run this when the cluster passes 150 nodes. The answer moves with cluster size, so it belongs on a calendar.
Two rules apply on every branch: instrument with OpenTelemetry so the next decision is cheap, and set a cardinality budget from the start — the one control that changes the bill by multiples on either platform.
Get a straight answer on your observability bill
Bring your Datadog invoice or your Prometheus cardinality report. We will model both options against your cluster and tell you which one wins — including whether a migration is worth the disruption.