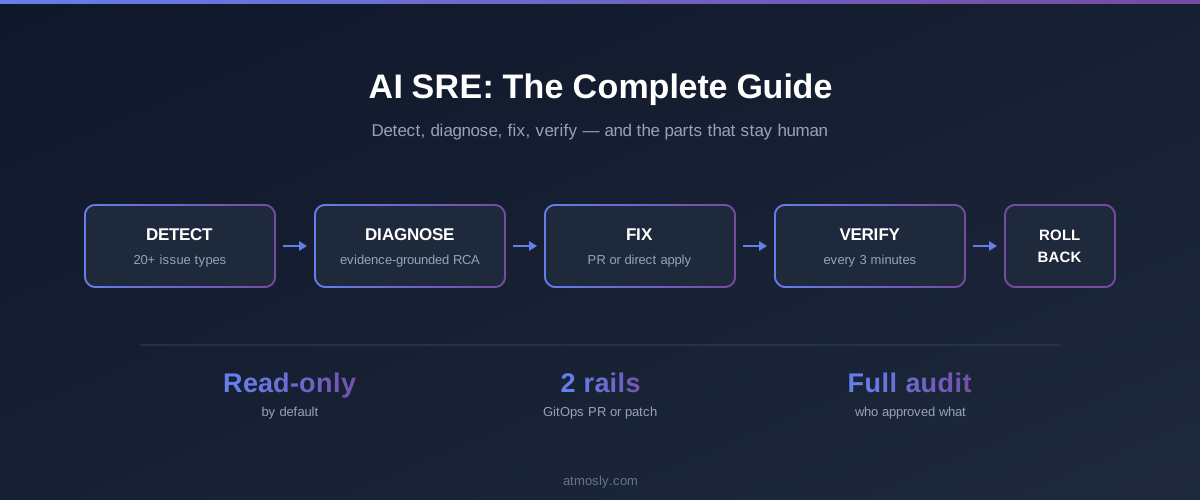
AI SRE means an agent that carries a Kubernetes incident from detection through diagnosis to a proposed fix, then checks whether the fix actually worked. The distinction from everything that came before is the last step. Alerting tools tell you something broke. Runbook automation runs a script you wrote months ago. An AI SRE agent reads the live cluster state, forms a diagnosis from evidence rather than from log prose, proposes a specific change with the reasoning attached, and re-checks the workload afterwards.
This guide covers the whole loop stage by stage, the permission model that decides how much autonomy you grant, when the approach fits and when it does not, and the limits worth knowing before you connect a production cluster. It is the entry point to a set of deeper articles linked throughout — start here, then follow the one that matches your problem.
What is AI SRE?
AI SRE is the practice of putting an autonomous agent inside the incident loop for Kubernetes operations. The agent watches cluster state continuously, correlates symptoms into a single incident, determines a root cause from structured evidence, and produces a remediation it can either hand to a human as a pull request or apply directly under an approval gate.
The term borrows from Google's Site Reliability Engineering discipline, where reliability is treated as an engineering problem with error budgets and measurable objectives. AI SRE does not replace that discipline. It automates the mechanical parts of it — the gathering, the correlating, the first-pass diagnosis — while judgement, prioritisation and stakeholder communication stay with people.
What AI SRE is not
Three adjacent things get confused with it, and the distinctions matter when you are evaluating tools.
It is not AIOps. AIOps grew out of log and metric analytics — anomaly scoring, event correlation, noise reduction over telemetry streams. It produces better signals for a human to act on. AI SRE produces an action. The two overlap on detection and diverge completely after it.
It is not runbook automation. A runbook encodes a fix that worked for a cluster state that existed when someone wrote it. It executes the same steps regardless of what is actually happening now. An agent reads current state and decides. Static runbooks rot; that is a property of the format, not a failure of the people maintaining them.
It is not monitoring with a chat interface. Wrapping a language model around a metrics API gets you a query tool. The difference is whether the system can carry an incident to a resolution and then confirm the resolution held.
How an AI SRE agent handles a Kubernetes incident
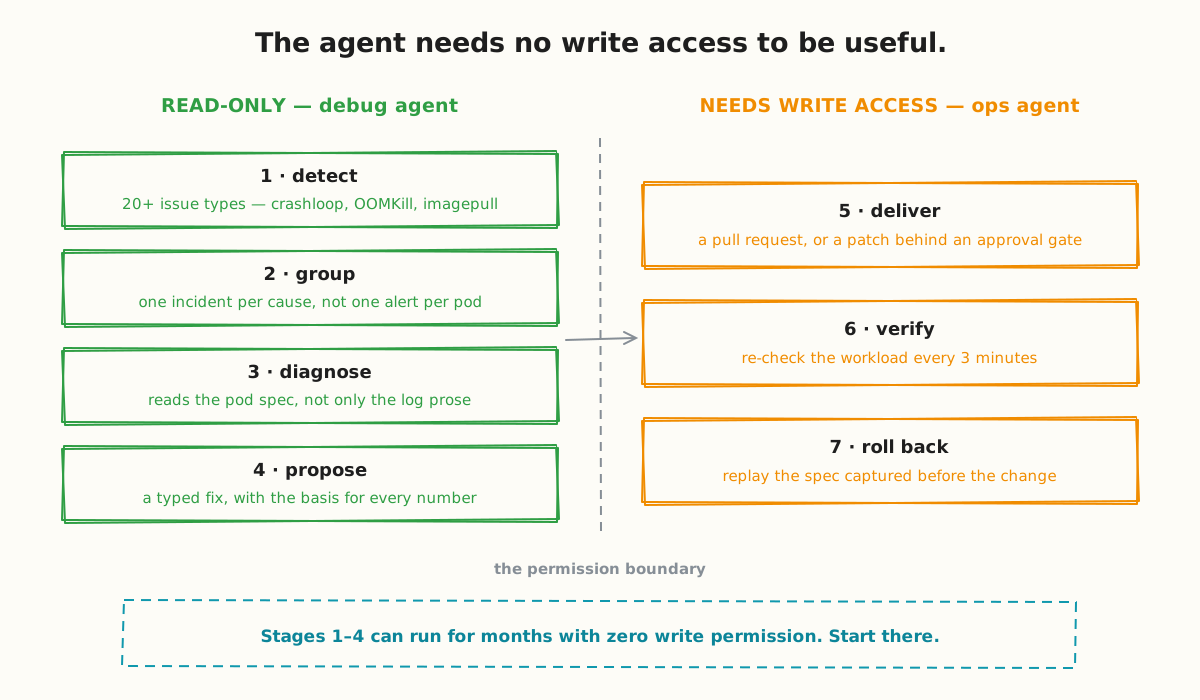
Seven stages, and the useful way to think about them is not chronological but by permission. The first four need no write access to your cluster at all. The last three do. Where you draw that line is the single biggest decision in adopting this category.
1. Detection
An in-cluster agent watches for failure signatures. Coverage differs sharply between tools and is rarely published, which makes it the first thing to compare directly. A useful baseline for Kubernetes is more than 20 issue types across pods and nodes: CrashLoopBackOff, OOMKilled, ImagePullBackOff and ErrImagePull, probe failures, unschedulable pods, missing ConfigMap and Secret references, node pressure and NotReady conditions, PVC binding failures, and HPA and ResourceQuota conditions.
See an incident investigated end to end.
Alert6 correlates alerts from your existing monitoring, investigates the evidence and proposes a fix your team approves. Read-only investigation by default.
Detection coverage is where you should push a vendor hardest, because the gaps are rarely advertised. Certificate expiry, control-plane and etcd health, and capacity trend forecasting are common gaps. If a tool claims to predict incidents before they happen, ask which specific failure classes — resource exhaustion and cert expiry are genuinely forecastable from a trend line; novel application failures are not.
2. Grouping
A single bad deployment produces one incident, not forty pod alerts. The agent assigns a group key so recurrences of the same problem accumulate against one record with an occurrence count, rather than paging someone forty times.
This sounds like a detail and it is the difference between a system your team keeps enabled and one they mute in week three. Alert fatigue in Kubernetes is a grouping problem before it is a threshold-tuning problem.
3. Diagnosis
This is where implementations diverge most, and where the quality of the whole system is decided.
A weak implementation feeds truncated container logs to a language model and returns whatever prose comes back. It will confidently identify a readiness probe problem because the word "probe" appeared in a log line, while the pod is dying with exit code 137.
A strong implementation runs the decision pass at temperature 0.0 against the full declared pod spec — probes, command and args, resource limits, environment references — plus per-container termination state, exit codes, and recent events, with the agent's own deterministic findings marked as ground truth. Temperature 0.0 matters for a decision: the same evidence must produce the same kubectl command every time. Creative variance is acceptable in an explanation and unacceptable in an action. Ask how many issue types the decision pass actually covers; the pod-level families behind most real incidents are the minimum.
For how this fits the wider incident lifecycle, see our guide to AI-powered incident response.
4. Proposal
The output is a typed remediation, not a paragraph of advice. It names the primitive (patch resource spec, roll back a rollout, reschedule a pod), the exact target, and the value.
Ask any vendor one question here: where did that number come from? If the answer is a default, the system is guessing and presenting the guess as analysis. A good implementation reads the current limit and request straight off the live Pod object at detection time, along with the name of the container that was actually OOMKilled, and resolves the real controller owner from ownerReferences rather than string-matching the pod name. The proposal carries a basis line stating which of those inputs produced the number — and when it genuinely has no usage data, the interface says so explicitly instead of presenting a default as derived.
That last behaviour is worth more than it looks. A system that admits when it is guessing is one you can calibrate trust against.
5. Delivery
Tools in this category deliver through one of three rails, and they suit different teams. The first two below are generic patterns, not a description of any one product.
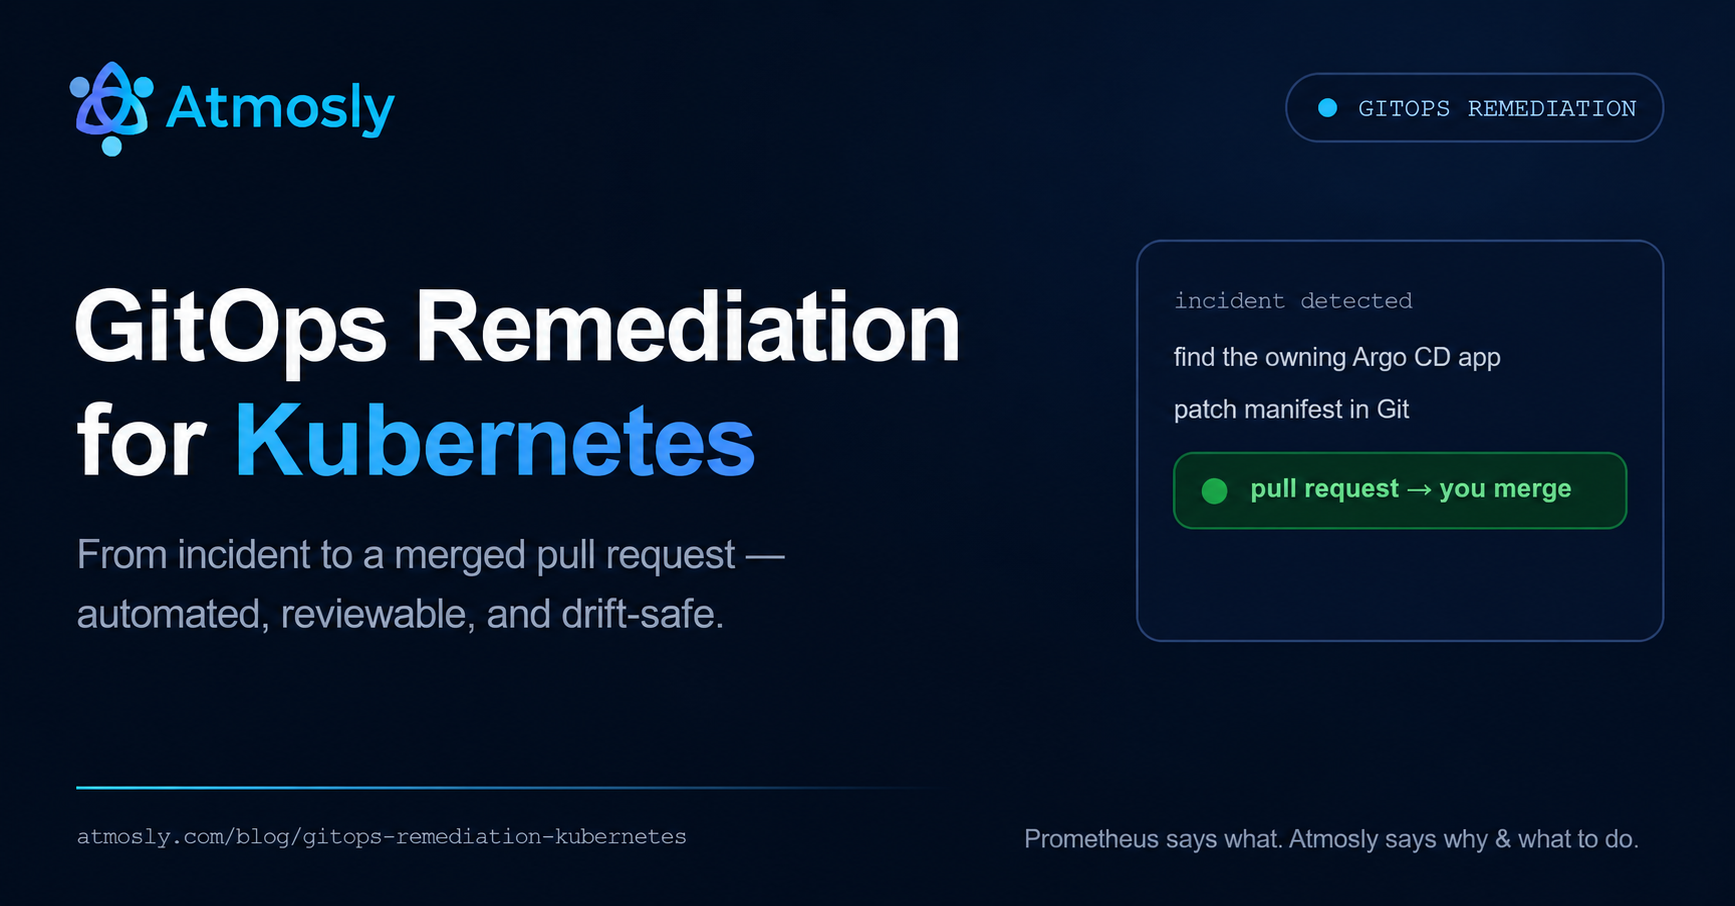
A GitOps pull request. A PR-based agent finds the ArgoCD Application that owns the workload, locates the source repository and path, patches the YAML, and opens a PR. Your existing review process applies unchanged — the fix arrives as a diff a human approves. It pauses ArgoCD auto-sync so the cluster does not fight the pending PR, with a time-boxed auto-resume so a forgotten PR cannot leave sync paused indefinitely. Details in GitOps remediation for Kubernetes.
One boundary to know: check which GitOps controllers the tool recognises. If detection is ArgoCD-only and Flux or a Helm operator manages your workloads, the agent cannot confirm GitOps ownership, the sync-pause protection does not apply, and a direct patch may be reverted on the next reconcile.
A direct patch. Faster, and appropriate for a cluster that is not GitOps-managed or for an incident where a PR cycle is too slow. A good implementation captures a rollback specification before mutating anything and exposes a revert window afterwards.
An approved runbook. This is Alert6's model. Instead of a pull request or an ad-hoc patch, it proposes a remediation runbook — commands, verification steps and a confidence score — that an authorized engineer approves, or that runs automatically only if it is explicitly allow-listed under policy and confidence thresholds, with every approval and execution audited. Alert6 does not open pull requests, so on a GitOps-managed cluster make sure the runbooks you approve change the repository rather than the live object.
6. Verification
Most tools stop at "applied" and record success. Applying a patch and confirming the problem is gone are different claims, and only one of them is worth anything at 3am.
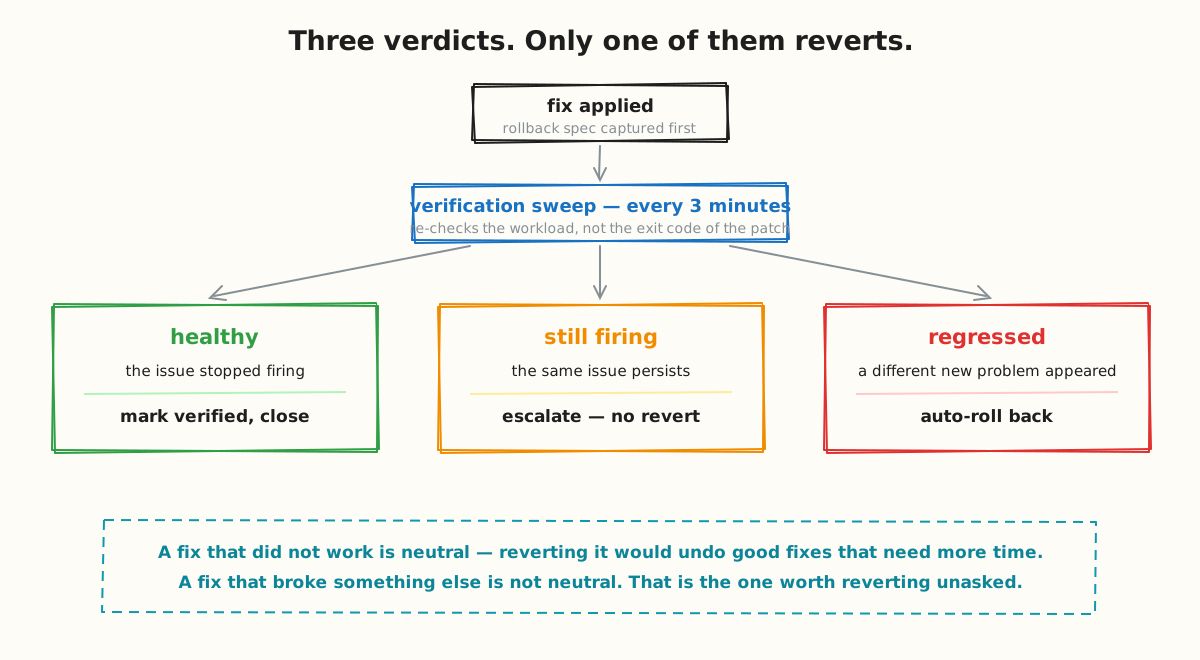
A sound implementation re-checks on an interval and distinguishes between outcomes instead of recording a binary success. A useful design is a sweep on a short fixed interval — every few minutes — that returns one of three verdicts. Ask any vendor what their interval is, and what happens on each result:
| Verdict | Meaning | Response |
|---|---|---|
healthy | The issue stopped firing | Mark verified, close |
still_firing | Same issue persists | Escalate to humans. No automatic revert |
regressed | A different new problem on the same workload | Automatic rollback |
The asymmetry is deliberate and it is the most interesting design decision in the loop. A fix that did not work is a neutral outcome — reverting it would undo correct fixes that need more time to take effect. A fix that broke something else is not neutral, and that is the case worth reverting without waiting for a human.
7. Rollback
Rollback replays the specification captured before the change. Primitives that cannot be reversed carry no rollback specification and escalate instead of attempting one.
The regression matcher is deliberately conservative — it compares cluster, namespace and workload name with guards for superseded issues, pod-versus-deployment mismatches and pre-existing problems, and when uncertain it returns "no regression". Falsely reverting a good fix is worse than missing a revert, so the bias runs that way on purpose.
When should you use AI SRE?
The approach earns its place under specific conditions:
- Your incidents are repetitive and diagnosable from cluster state. OOMKills, image pull failures, crash loops from a bad config, resource exhaustion. These have deterministic signatures and a small set of correct fixes.
- You run more clusters than people. The correlation problem across a fleet is where human triage stops scaling first.
- On-call is a retention problem. If engineers are leaving or refusing rotation, the cost of the status quo is already high.
- You have GitOps in place. The PR rail fits your existing review process with no new approval mechanism to design.
When should you avoid it?
Being honest about this matters more than the pitch:
- Your incidents are application logic, not infrastructure. An agent reading Kubernetes state cannot diagnose a race condition in your payment service. It will correctly report that the pod restarted and tell you nothing you needed.
- You have one cluster and two engineers who know it well. The overhead of evaluating, connecting and calibrating exceeds the time saved.
- Your change process cannot absorb another actor. If every production change needs a CAB ticket, an agent opening PRs adds friction rather than removing it. Start read-only.
- You need audited autonomy limits today. If your security review demands enforced blast-radius caps and namespace allow-lists, verify the tool has them — see the limits section below.
The trade-offs: speed, coverage and auditability
Three worth stating plainly.
Speed against certainty. A direct patch resolves in seconds and skips review. A PR takes as long as your review cycle and gives you a diff, an approver and a git history. Neither is correct in general; teams typically want the PR rail for anything touching production and the direct rail for lower environments.
Coverage against precision. An agent that proposes a fix for every issue type will propose bad fixes for the types it understands poorly. Narrower coverage with high confidence beats broad coverage that needs constant correction.
Autonomy against auditability. Every step of autonomy you grant removes a human record of intent. This is manageable — an audit trail capturing requester, approver, the exact change, the rollback spec and the post-apply verdict substitutes for that record — but it has to exist before you grant the autonomy, not after.
What to evaluate before connecting a cluster
A checklist to run against any tool in this category, including Alert6:
- Is there a read-only mode, and is it a real deployment mode? Not a trial tier. You should be able to run detection and diagnosis for months with no write permission. (One clean pattern is two agent flavours — a read-only debug agent and a separate mutation-capable ops agent.)
- What is the permission scope of the mutating component? Cluster-admin is a red flag. Ask for the specific RBAC verbs and resources.
- Is there a human approval gate, and can requester and approver be different people?
- Which primitives can it actually execute? Vendors list what they can propose. Ask what they can apply — the two lists differ. (It is common for a tool to declare many primitives and execute only a few; check whether node operations like cordon and drain are among them.)
- Does it verify after applying, and what does it do on each outcome?
- Is every change reversible, and does the tool know which are not?
- What does the audit trail record? Who requested, who approved, what changed, what the rollback would be, whether an operator overrode the suggested value, and what happened afterwards.
- Where do the proposed numbers come from? Ask to see a fix where the tool had no usage data and check what it did.
- Does it check the fix is feasible before offering it? Offering "roll back to the previous revision" on a Deployment with one revision is a no-op dressed as a fix.
What no AI SRE tool does well yet
These limits apply across the category, not to one product. A vendor claiming otherwise is worth a second look.
Application-logic incidents. An agent reading Kubernetes state can tell you a pod restarted and which container died. It cannot tell you that your payment service deadlocks under a specific concurrency pattern. Cluster state is the boundary, and many real production incidents live outside it.
Genuinely novel failures. These systems are strong on failure signatures they have a shape for — OOMKills, image pull errors, crash loops. A first-of-its-kind failure produces a confident-sounding diagnosis assembled from the nearest familiar pattern, which is worse than no diagnosis. This is the failure mode to probe hardest in a trial.
Judgement under competing priorities. Two incidents, one engineer, a release in progress. Which matters more is a business question. No agent in this category attempts it.
Incidents spanning systems outside the cluster. When recovery involves a payment provider, a DNS registrar and a customer comms decision, a Kubernetes-scoped agent covers one part of it.
Limits to ask every vendor about
Ask every vendor for a written list of where their product stops. These questions separate honest answers from marketing:
Does it learn from your incident history? Many tools store closure notes and display them without feeding them back into diagnosis. Treat "gets smarter with every incident" as a claim to verify rather than assume.
Does it report MTTR? Some tools have no analytics surface for mean time to resolution, auto-resolution rate or fix success rate. If yours does not, you measure them yourself.
Does it enforce autonomy policy? Read-only modes, RBAC scoping, approval gates and PR-based delivery are meaningful controls, and they are not the same as a policy engine with explicit allow-lists and confidence thresholds. Ask which one you are getting.
Does it dry-run against the cluster? Checking preconditions — rollout history depth before a rollback, controller ownership before a reschedule, value validity before a patch — is good. A server-side admission check confirming the cluster will accept the change is better, and rarer.
Does it reach your paging tool, and where do approvals happen? Notifications that stop at email or one-way chat cards leave the approval step somewhere the on-call engineer is not.
For reference, Alert6's answers: it investigates read-only by default, executes only runbooks an authorized engineer approves or that are explicitly allow-listed under policy and confidence thresholds, records every approval and execution in an audit log, integrates with Slack, PagerDuty, Jira and webhooks, and reports SLOs, error budgets and median time to resolve per service.
How to roll out AI SRE safely
The adoption path that works, in order:
- Connect one non-production cluster in read-only mode. No write permission. Let it detect and diagnose for two weeks.
- Grade the diagnoses. For each incident it caught, would you have reached the same conclusion? This is your calibration data, and it costs nothing to gather.
- Turn on the PR rail in staging. Fixes arrive as diffs. Review every one. You are checking whether the proposed value is defensible, not whether the syntax is valid.
- Extend to production with the approval gate on. Nothing mutates without a named approver.
- Relax selectively. Direct apply for specific low-risk, reversible primitives in specific namespaces — once you have the track record to justify it.
Teams that skip to step four and hit one bad fix disable the whole thing and do not come back. The calibration in steps one and two is what makes the rest defensible internally.
If you are choosing between tools, the AI SRE tool comparison covers how the main options differ. Alert6 is SquareOps' AI SRE platform: it correlates alerts, investigates live telemetry and recent changes, and proposes fixes your team approves or safely automates.
Investigation is read-only by default, so you can see what it concludes on your own incidents before allowing it to run anything — book an Alert6 demo.