The Real Cost of Alert Fatigue
Alert fatigue does not announce itself with a single incident. It builds gradually: an on-call engineer starts ignoring non-critical pages because most of them auto-resolve. Then they start delaying response to all pages because experience has taught them that 80% are noise. Eventually, a real incident gets the same slow response as a false alarm, and users are affected for minutes that could have been seconds.
The cost shows up in three places. First, incident response degrades — mean time to acknowledge climbs as engineers lose trust in the alerting system. Second, attrition increases — on-call rotations become the number one reason engineers cite for leaving teams. Third, reliability suffers — the team builds fewer reliability improvements because they spend their energy managing alert noise instead of fixing root causes.
If you have already assessed your team's SRE maturity and identified monitoring or incident management as a weak domain, alert fatigue is almost certainly a contributing factor.
Running a Noise Audit
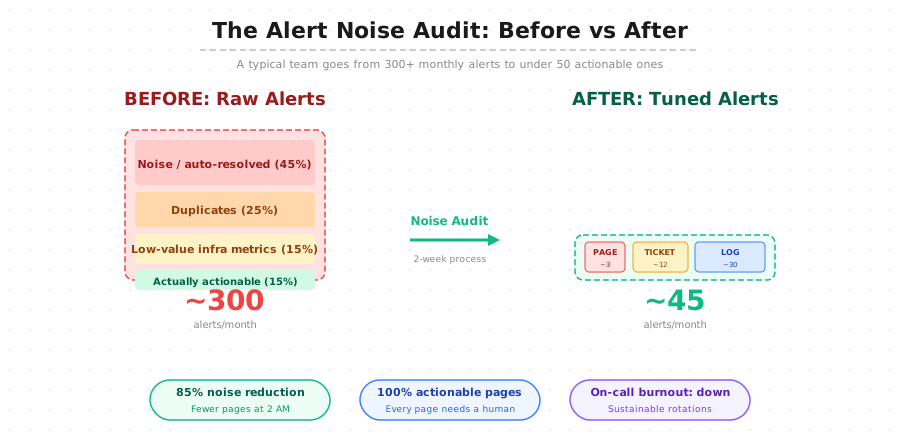
Before tuning any alert rules, you need data on what is actually firing and whether it is useful. A noise audit is a two-week structured review of every alert that reaches a human.
The Two-Week Audit Process
For every alert that fires during the audit window, the on-call engineer tags it with one of four labels:
| Label | Definition | Expected Action After Audit |
|---|---|---|
| Actionable | Required human investigation and intervention | Keep as-is or promote to higher severity |
| Auto-resolved | Resolved before the engineer could respond | Increase threshold, add duration requirement, or downgrade to log |
| Duplicate | Same root cause already covered by another alert | Consolidate into a single alert with grouped context |
| Informational | Useful to know but did not require action | Move to dashboard or log layer, remove notification |
Most teams find that 70-85% of their alerts fall into the auto-resolved, duplicate, or informational categories. That is the noise budget you can eliminate without losing any signal.
What to Do With Audit Results
After the two-week window, group the results by alert rule. Any rule where fewer than 30% of firings were labeled "actionable" is a tuning candidate. The typical outcomes: increase the threshold (alert on 90% disk instead of 75%), add a duration requirement (alert only if the condition persists for 10 minutes), consolidate duplicates into a single grouped alert, or move the rule to the log layer entirely.
The Three-Layer Alert Framework
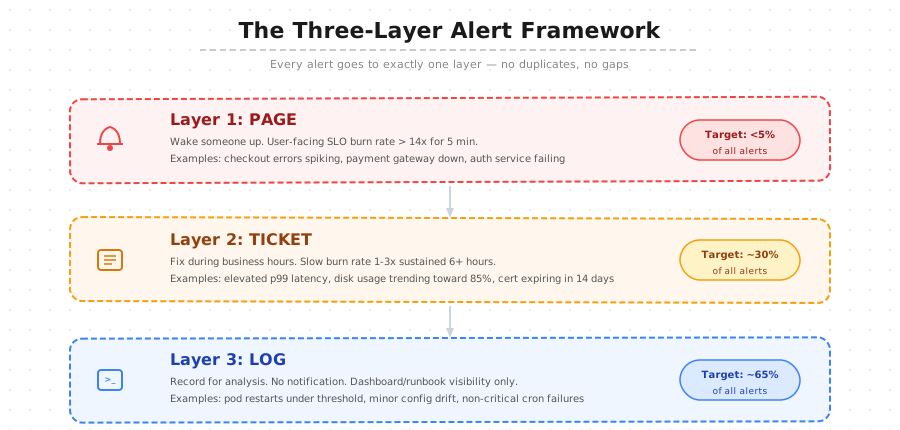
Once the noise audit identifies which alerts matter, reorganize them into three distinct layers. Every alert goes to exactly one layer — no duplicates across layers, no gaps between them.
Layer 1: Page
Pages interrupt whatever the on-call engineer is doing — sleep, dinner, focus time. The bar for a page should be high: the issue is actively affecting users AND requires immediate human intervention AND cannot wait until morning.
Page alerts should be tied to SLO burn rate rather than raw infrastructure metrics. "Error budget burning at 14x for 5 minutes" is a page. "CPU at 85%" is not — unless CPU directly causes user-facing degradation, in which case the SLO will catch it anyway.
Target: less than 5% of total alert volume. If more than 5% of your alerts are pages, either your services are genuinely unreliable (which is a separate problem) or your page thresholds are too sensitive.
Layer 2: Ticket
Tickets are issues that need human attention but can wait for business hours. Slow SLO burn rates (1-3x sustained for 6+ hours), trending resource exhaustion (disk at 85% and growing), certificate expirations within 14 days, and configuration drift detected by policy checks.
Ticket alerts create work items in your issue tracker automatically. The on-call engineer triages them during their shift but is not expected to fix them immediately. Target: roughly 30% of total alert volume.
Layer 3: Log
Logs are recorded for analysis and troubleshooting but do not notify anyone. Pod restarts below threshold, minor cron job failures, non-critical service degradation, and metrics that are useful during incident investigation but do not independently warrant attention.
These alerts show up on dashboards and in runbooks. Engineers consult them when investigating a page or ticket, but they never generate notifications. Target: roughly 65% of total alert volume.
Why This Split Works
The three-layer framework works because it aligns notification urgency with the required response time. Engineers learn that a page always means "drop everything," a ticket means "look at this today," and a log means "this is context, not action." That trust is what prevents alert fatigue — every notification the engineer receives deserves their attention.
Alert Tuning Techniques
After categorizing alerts into layers, apply these tuning techniques to reduce noise within each layer.
Duration-Based Suppression
Most transient spikes self-resolve within 2-5 minutes. Adding a duration requirement ("condition must persist for 10 minutes before alerting") eliminates the single biggest source of noise. Apply this to every infrastructure metric alert: CPU, memory, disk, network latency. If the spike resolves before the duration expires, no alert fires.
Hysteresis / Recovery Delay
An alert that fires and resolves repeatedly ("flapping") is worse than no alert. Add a recovery delay: once an alert fires, it stays active for a minimum period (typically 15-30 minutes) even if the metric briefly dips below threshold. This prevents the notification storm that comes from flapping conditions.
Alert Grouping and Deduplication
When a Kubernetes node goes down, you do not need 15 separate alerts for each pod on that node. Alert grouping consolidates related firings into a single notification with context about all affected components. Most modern alerting tools (Alertmanager, PagerDuty, Opsgenie) support grouping natively — the challenge is configuring the grouping keys correctly.
Dynamic Thresholds
Static thresholds ("latency above 500ms") do not account for expected variation. A batch processing service that routinely spikes to 800ms during daily imports should not page every morning. Dynamic thresholds use baseline comparisons: "latency 3x higher than the same hour last week" catches real degradation without false-firing on expected patterns.
On-Call Rotation Design
Alert tuning reduces noise, but the rotation structure determines whether on-call is sustainable even with clean alerts. A well-tuned alerting system paired with a poorly designed rotation still leads to burnout.
Rotation Anti-Patterns
| Anti-Pattern | Problem | Better Approach |
|---|---|---|
| 7-day rotations | Entire week of interrupted sleep | 3-4 day rotations or follow-the-sun |
| 2-person rotation | On-call every other week, no flexibility | Minimum 5-person rotation (on-call every 5 weeks) |
| No secondary on-call | Single point of failure, no escalation path | Primary + secondary with clear escalation policy |
| On-call without comp time | Engineers absorb cost, resent builds | Comp day after each rotation, or financial compensation |
| On-call owns all follow-up | On-call engineer carries incident debt into next sprint | On-call triages; team owns remediation in sprint planning |
Follow-the-Sun for Distributed Teams
If your team spans 3+ time zones, follow-the-sun rotations eliminate overnight pages entirely. Each geographic region covers business hours plus a few hours on each side. The handoff happens during overlapping hours, with the outgoing on-call briefing the incoming on-call on any active issues.
This approach requires at least 3 engineers per region to maintain a sustainable rotation within each geography. For smaller teams, a hybrid model works: follow-the-sun during weekdays, with a single global rotation (with compensation) on weekends.
On-Call Runbooks
Every page-level alert should have a linked runbook that tells the on-call engineer what to check, what to do, and when to escalate. A good runbook is not a wiki article — it is a decision tree that gets the engineer from alert to resolution (or escalation) in under 10 minutes.
Runbook minimum structure: what the alert means in plain language, what to check first (top 3 diagnostic steps), what to do if the diagnosis confirms the expected root cause, when to escalate (if the issue does not match expected patterns or if resolution requires access the on-call does not have).
Continuous Alert Review
Alert tuning is not a one-time project. Services evolve, traffic patterns shift, new features introduce new failure modes, and alert rules that made sense 6 months ago may be generating pure noise today.
Quarterly Noise Audit
Repeat the two-week noise audit process every quarter. Compare results against the previous quarter to track whether noise is increasing or decreasing. If noise is increasing, identify which new alert rules are responsible and whether they were properly categorized when created.
Post-Incident Alert Review
After every significant incident, review the alerting chain. Did the right alert fire? Did it fire fast enough? Were there false alerts that distracted from the real issue? Were there missing alerts that would have caught the problem earlier? Add these findings to the incident review template so alerting improvements are a standard output of every postmortem.
New Alert Approval Process
Require that every new page-level alert rule includes: a linked runbook, an assigned layer (page/ticket/log) with justification, an expected firing frequency, and a review date (typically 30 days after creation). This prevents the gradual accumulation of poorly-thought-out alerts that drives noise upward over time.
Alert Health Metrics
Track these metrics on a team dashboard to maintain visibility into alerting system health.
| Metric | Target | Why It Matters |
|---|---|---|
| Signal-to-noise ratio | > 70% actionable | Measures overall alert quality. Below 50% indicates a noise problem. |
| Pages per on-call shift | < 2 per 12-hour shift | Primary indicator of on-call sustainability. Above 5 predicts burnout. |
| Mean time to acknowledge | < 5 minutes for pages | Slow acknowledgment suggests fatigue or distrust in alert quality. |
| Alert rules without runbook | 0 for page-level alerts | Unrunbooked pages increase resolution time and on-call stress. |
| Repeat offenders (top 5 rules by fire count) | Review monthly | Identifies alert rules that generate disproportionate noise. |
| Flapping alerts | 0 in page layer | Flapping pages are the single worst contributor to on-call fatigue. |
Track these monthly and report them alongside your SLO status in team retrospectives. If signal-to-noise drops below 50% or pages per shift exceeds 5, treat it as a reliability incident and schedule a noise audit.
Putting It All Together
Alert fatigue reduction follows a predictable sequence: audit the noise, categorize into three layers, tune the rules, design a sustainable rotation, and review continuously. The entire first pass takes 4-6 weeks. Subsequent quarterly reviews take a few days.
| Week | Activity | Output |
|---|---|---|
| 1-2 | Run noise audit (tag every alert) | Alert classification spreadsheet |
| 3 | Categorize alerts into three layers | Updated alerting rules with layer assignments |
| 4 | Apply tuning (duration, grouping, dynamic thresholds) | Reduced alert volume, updated thresholds |
| 5 | Write runbooks for all page-level alerts | Linked runbooks for every page alert |
| 6 | Review rotation structure and set up health metrics dashboard | Sustainable rotation, alert health dashboard |
The framework is tool-agnostic — it works whether you are on PagerDuty, Opsgenie, Grafana OnCall, or a custom setup. The principles (layer separation, burn rate alerting, noise audits) apply regardless of your observability stack.
When to Bring In Help
Alert fatigue reduction is one of those problems where the solution is clear but the execution requires deep familiarity with your specific alert rules, service dependencies, and team dynamics. Common sticking points: identifying which alerts are truly critical versus "we've always had this alert and nobody wants to delete it," setting appropriate SLO-based burn rate thresholds for the first time, and getting leadership buy-in for compensated on-call rotations.
If your team has been talking about alert fatigue for more than a quarter without measurable improvement, an experienced SRE consulting engagement can compress the timeline. The value is in the noise audit execution (an outsider has no attachment to legacy alert rules) and in establishing the review cadence that prevents noise from accumulating again. Teams that combine alert tuning with proper SLO design and observability infrastructure typically see the biggest and most sustained improvements in on-call health.