Why an SRE Maturity Assessment Matters in 2026
Every engineering organization goes through the same journey: you start by firefighting production issues, gradually build monitoring, eventually define SLOs, and (if you're disciplined) reach a state where systems self-heal and teams proactively prevent incidents before they impact users.
The challenge is knowing exactly where you are on that journey. Without a structured assessment, teams tend to overestimate their maturity in areas they're comfortable with and underestimate gaps in areas they haven't thought about. The result is lopsided reliability — strong monitoring but no SLOs, or well-defined SLOs but manual incident response that burns out on-call engineers.
This assessment framework gives you an objective score across the 6 domains that define SRE maturity. Whether you're a startup building your first on-call rotation or an enterprise optimizing an existing SRE practice, the framework tells you where to invest next.
The 6 Domains of SRE Maturity
SRE maturity isn't a single dimension. A team can have excellent monitoring but terrible incident management, or strong automation but no SLOs. The framework evaluates 6 distinct domains that together define how mature your reliability practice is.
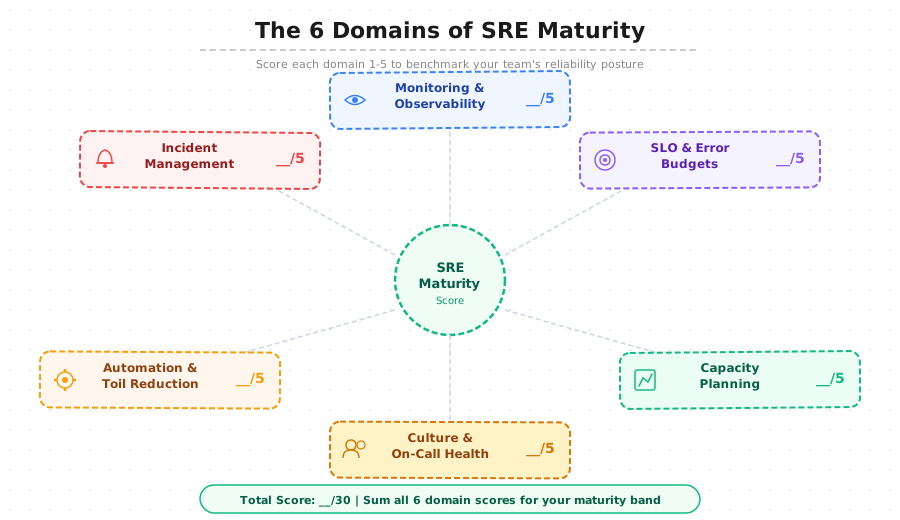
Each domain is scored from 1 (ad-hoc) to 5 (predictive), and your total score across all 6 domains determines your overall maturity band.
Domain 1: Monitoring and Observability
This domain measures how well you can see what's happening across your systems. It goes beyond "do you have Prometheus installed?" to evaluate whether your observability stack actually helps you find and fix problems faster.
What to evaluate:
- Metrics coverage — Are you collecting RED metrics (Rate, Errors, Duration) for every user-facing service? Do you have infrastructure metrics (CPU, memory, disk, network) with appropriate retention periods?
- Logging — Are logs structured (JSON), centralized, and searchable? Can you correlate logs across services using trace IDs or request IDs?
- Distributed tracing — Can you follow a request end-to-end across microservices? Are traces connected to logs and metrics for a unified view?
- Dashboards — Do you have service-level dashboards that answer "is this service healthy?" in under 30 seconds? Are dashboards maintained and reviewed regularly, or are they abandoned after initial creation?
Scoring guide: Score 1 if you only have basic server monitoring (CPU/memory). Score 3 if you have structured logging, APM, and service-level dashboards. Score 5 if you have full distributed tracing with automated anomaly detection and correlation across all three pillars (metrics, logs, traces).
Domain 2: Incident Management
This domain evaluates your ability to detect, respond to, and learn from production incidents. Teams with immature incident management rely on customers to report issues. Mature teams detect incidents automatically, resolve them quickly, and systematically prevent recurrence.
What to evaluate:
- Detection — How do you learn about incidents? Customer reports (bad), automated alerts (good), or predictive detection before user impact (excellent)?
- Response process — Do you have a defined incident response workflow with clear roles (incident commander, communications lead)? Or does everyone pile into a Slack channel hoping someone knows what to do?
- Communication — Do you have status pages, stakeholder notification templates, and defined escalation paths? Can you communicate incident status to business stakeholders in non-technical language?
- Post-incident review — Do you run blameless postmortems for every significant incident? Do postmortem action items actually get completed, or do they rot in a backlog?
Scoring guide: Score 1 if incidents are reported by customers and resolved ad-hoc. Score 3 if you have automated alerting, a documented runbook library, and regular postmortems. Score 5 if you have incident grouping, automated root cause suggestions, prior resolution context for recurring issues, and a track record of completing postmortem action items within sprint cycles.
Domain 3: SLOs and Error Budgets
Service Level Objectives (SLOs) and error budgets transform reliability from a gut feeling into a measurable, actionable metric. This domain evaluates whether your team has moved beyond "five nines" vanity metrics to SLOs that actually drive engineering decisions.
What to evaluate:
- SLI selection — Are your Service Level Indicators based on real user experience (request latency at p99, availability per critical user journey), or just infrastructure metrics (server uptime)?
- SLO targets — Are targets based on business requirements and user expectations, or copied from competitors? Have you done the math on what 99.9% vs 99.95% actually means for your error budget?
- Error budget policy — Do you have a written policy that defines what happens when the error budget is exhausted? Does the team actually follow it (freeze releases, prioritize reliability work)?
- Integration with planning — Are SLOs reviewed in sprint planning and quarterly reviews? Do they influence staffing, on-call load, and architecture decisions?
Scoring guide: Score 1 if you have no SLOs or only informal uptime targets. Score 3 if you have SLOs for critical services with automated tracking and alerting on budget burn rate. Score 5 if error budgets drive release decisions, SLOs are reviewed quarterly with stakeholders, and SLI selection is based on user journey mapping.
For a deeper walkthrough of SLI selection, error budget math, and writing a policy your team will actually follow, see our guide on setting SLOs and error budgets that reduce on-call burnout.
Domain 4: Automation and Toil Reduction
Google defines toil as "the kind of work tied to running a production service that tends to be manual, repetitive, automatable, tactical, devoid of enduring value, and that scales linearly as a service grows." This domain measures how systematically your team identifies and eliminates toil.
What to evaluate:
- Toil measurement — Do you track how much time your team spends on toil vs. engineering work? Google's benchmark is keeping toil below 50% of SRE time.
- Automation coverage — Are common operational tasks automated (deployments, scaling, certificate rotation, backup verification)? What percentage of incident remediation is automated vs. manual?
- Self-healing — Can your systems automatically recover from common failure modes (pod restarts, node replacements, traffic rerouting) without human intervention?
- IaC and GitOps — Is all infrastructure defined as code? Are changes deployed through GitOps pipelines with automated validation, or are engineers SSH-ing into servers?
Scoring guide: Score 1 if most operational work is manual (SSH, kubectl apply, console clicks). Score 3 if deployments are automated via CI/CD, infrastructure is managed with Terraform/Pulumi, and common remediations have runbooks. Score 5 if toil is tracked and consistently below 30%, self-healing handles most common failures, and GitOps-based remediation can automatically patch and deploy fixes.
Domain 5: Capacity Planning
This domain evaluates whether your team proactively manages capacity or reactively responds to resource exhaustion. Mature capacity planning prevents both over-provisioning (wasting money) and under-provisioning (causing outages).
What to evaluate:
- Resource forecasting — Can you predict resource needs 3-6 months ahead based on growth trends? Do you model capacity for peak events (product launches, seasonal traffic)?
- Right-sizing — Do you regularly review and right-size compute, storage, and database resources? Are recommendations data-driven or based on guesswork?
- Load testing — Do you run regular load tests that validate your capacity assumptions? Do you test beyond expected peak (e.g., 2x normal traffic)?
- Cost awareness — Does the team understand the cost implications of capacity decisions? Is there a feedback loop between capacity planning and cloud cost management?
Scoring guide: Score 1 if you provision reactively when things break. Score 3 if you right-size quarterly, run basic load tests, and have cost visibility per service. Score 5 if you have automated capacity forecasting, continuous load testing in CI/CD, and capacity decisions that are jointly optimized for performance and cost.
Domain 6: Culture and On-Call Health
The most overlooked domain. You can have perfect tooling and processes, but if your on-call rotation burns people out, your SRE practice will fail. This domain measures the human side of reliability.
What to evaluate:
- On-call load — How many pages per shift does the primary on-call receive? More than 2 actionable pages per 12-hour shift indicates an alert noise problem. What's the ratio of actionable to non-actionable pages?
- Rotation design — Do you have primary/secondary/shadow rotations? Is rotation length appropriate (1-week max)? Do engineers get compensated for on-call time?
- Knowledge sharing — Is tribal knowledge documented in runbooks, or does it live in one person's head? Can a new team member handle on-call within their first rotation?
- Team health — Do you track on-call satisfaction? Is there management support for reliability work, or is it always deprioritized for features? Are engineers leaving because of on-call burden?
Scoring guide: Score 1 if on-call is uncompensated, rotations are ad-hoc, there are no runbooks, and engineers dread their shifts. Score 3 if rotations are structured, runbooks exist for common issues, and on-call load is manageable. Score 5 if you track on-call satisfaction metrics, have shadow rotations for training, pages are rare and always actionable, and there's a feedback loop that continuously improves on-call quality.
If this domain is your weakest, the practical starting point is alert hygiene — see our framework for reducing alert fatigue.
Self-Assessment Checklist: Score Your Team
For each domain above, assign a score from 1 to 5 based on the scoring guides. Be honest — this assessment is only useful if it reflects reality, not aspirations. If you're unsure between two scores, pick the lower one.
| Domain | Your Score (1-5) |
|---|---|
| Monitoring and Observability | ___ |
| Incident Management | ___ |
| SLOs and Error Budgets | ___ |
| Automation and Toil Reduction | ___ |
| Capacity Planning | ___ |
| Culture and On-Call Health | ___ |
| Total Score | ___/30 |
Interpreting Your Score: What Each Band Means
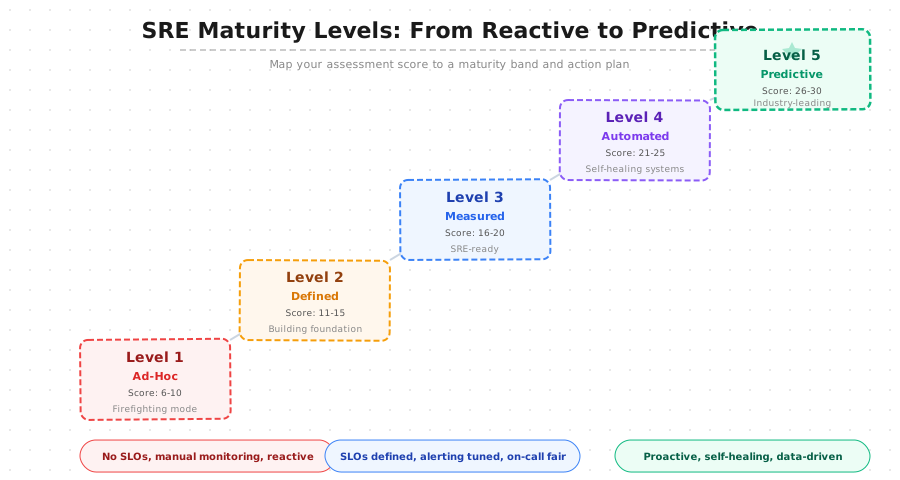
Your total score maps to one of five maturity bands. Each band describes not just where you are, but what you should focus on next.
Score 6-10: Level 1 — Firefighting
Your team is in reactive mode. Incidents are discovered by users, resolved through heroic individual effort, and rarely analyzed for prevention. There are no SLOs, monitoring is basic (if it exists), and on-call is something nobody wants to do. This is where most startups begin and where many mid-stage companies get stuck.
Priority actions: Set up basic monitoring with alerting (Prometheus + Grafana or Datadog), define an incident response process (even a simple one-page doc), and establish a fair on-call rotation. Don't try to boil the ocean — just get the foundations in place.
Score 11-15: Level 2 — Building Foundation
You have the basics: monitoring, alerting, some kind of incident process. But it's inconsistent — some services are well-monitored while others are blind spots. SLOs may exist on paper but don't drive decisions. Postmortems happen for big incidents but action items rarely get completed.
Priority actions: Standardize monitoring across all services, define SLOs for your top 3-5 critical services, and start tracking toil. Build a runbook library for your most common incidents.
Score 16-20: Level 3 — SRE-Ready
This is where most well-run engineering teams land. You have solid monitoring, defined SLOs, structured incident response, and some automation. The gap is usually in systematic toil reduction, error budget policies that actually drive decisions, and proactive capacity planning.
Priority actions: Implement error budget policies and integrate them into sprint planning. Start measuring and reducing toil systematically. Build capacity forecasting models. This is the level where investing in a dedicated SRE function or outsourced SRE engagement starts to have the highest ROI.
Score 21-25: Level 4 — Automated
Your reliability practice is strong. SLOs drive decisions, toil is tracked and actively reduced, most operational work is automated, and on-call is manageable. The remaining gap is usually in predictive capabilities — using data to prevent incidents before they happen.
Priority actions: Invest in anomaly detection, automated capacity forecasting, and chaos engineering. Focus on reducing MTTR through automated remediation. Consider building or adopting AI-assisted incident detection and resolution tools.
Score 26-30: Level 5 — Predictive
You're operating at the level of the best SRE teams in the industry. Systems self-heal, capacity scales proactively, incidents are rare and quickly resolved with institutional memory. Your challenge now is maintaining this level while the system grows in complexity.
Priority actions: Focus on knowledge sharing across the organization, contributing to the broader SRE community, and ensuring your practices scale with growth. Consider how AI and ML can further enhance predictive capabilities.
From Assessment to Action: Building Your SRE Roadmap
The assessment score is useful, but the real value is in the gap analysis. Here's how to turn your scores into an actionable roadmap.
Step 1: Identify your weakest domain. Look at which domain scored the lowest. This is usually where the highest-impact improvements are. A team with strong monitoring (score 4) but poor incident management (score 1) will get more value from fixing incident management than from pushing monitoring from 4 to 5.
Step 2: Check for blocking dependencies. Some domains depend on others. You can't effectively use error budgets (Domain 3) without solid monitoring (Domain 1). You can't automate incident remediation (Domain 4) without a clear incident management process (Domain 2). Fix foundations before building on them.
Step 3: Set quarterly targets. Aim to improve your weakest domain by 1 level per quarter. Moving from Level 1 to Level 2 in incident management is achievable in 3 months. Jumping from Level 1 to Level 4 in one quarter is not.
Step 4: Assign ownership. Each improvement initiative needs an owner who is accountable for progress. "The team" is not an owner. Name a person, give them time (at least 20% of their sprint capacity), and review progress monthly.
Step 5: Re-assess quarterly. Run this assessment every quarter to track progress. The score trends matter more than the absolute numbers — are you improving steadily, or have you plateaued?
How This Differs from a DevOps Maturity Model
You may already be familiar with DevOps maturity models like the SquareOps DevOps Maturity Assessment. While there's overlap, SRE maturity focuses specifically on production reliability — the "run" side of software, not the "build" side.
Key differences:
- DevOps maturity emphasizes CI/CD velocity, deployment frequency, and developer experience. It answers "how fast can we ship?"
- SRE maturity emphasizes reliability, incident response, and error budgets. It answers "how reliably do we run what we've shipped?"
- The intersection is in automation, infrastructure-as-code, and monitoring — but the lens is different. DevOps looks at build pipelines; SRE looks at production health.
The best engineering organizations score high on both. Fast shipping without reliability creates chaos. Reliability without shipping velocity creates stagnation. Use both assessments together to get the full picture.
There's a third lens worth knowing about: the Cloud Operations Maturity Model, which takes a broader, more strategic view across your entire cloud estate — governance, cost management, security posture, and operating model. Where this SRE assessment is a hands-on scoring tool for a single reliability practice, the Cloud Operations model is the organizational framework that sits above it. If your scores here point to structural problems rather than technical ones — no clear service ownership, no budget allocated to reliability work, no executive sponsorship — start there instead.
When to Bring in External Help
If your team scores below Level 3 (under 16) and you don't have dedicated SRE expertise in-house, consider whether an external SRE engagement could accelerate your maturity journey. Common scenarios where external help pays for itself:
- You're stuck at Level 1-2 and don't know what "good" looks like — An experienced SRE partner can run the assessment with you, identify the highest-impact improvements, and help implement them. What might take your team 6 months to figure out through trial and error, an experienced partner can implement in 6 weeks.
- You need 24/7 on-call coverage but can't hire for it — Building a 24/7 on-call rotation requires at least 4-5 SREs. Outsourcing SRE gives you coverage without the hiring timeline and cost.
- You have the tools but not the processes — Many teams invest in observability platforms (Datadog, New Relic, Grafana) but never build the SLO frameworks, incident response workflows, or toil reduction practices that make those tools effective.
The assessment framework in this article is the same one SquareOps uses when onboarding new SRE consulting and managed SRE engagements. It gives both sides a shared language for where you are, where you need to be, and what it will take to get there. If you'd like help running this assessment against your own environment, get in touch with our SRE team.