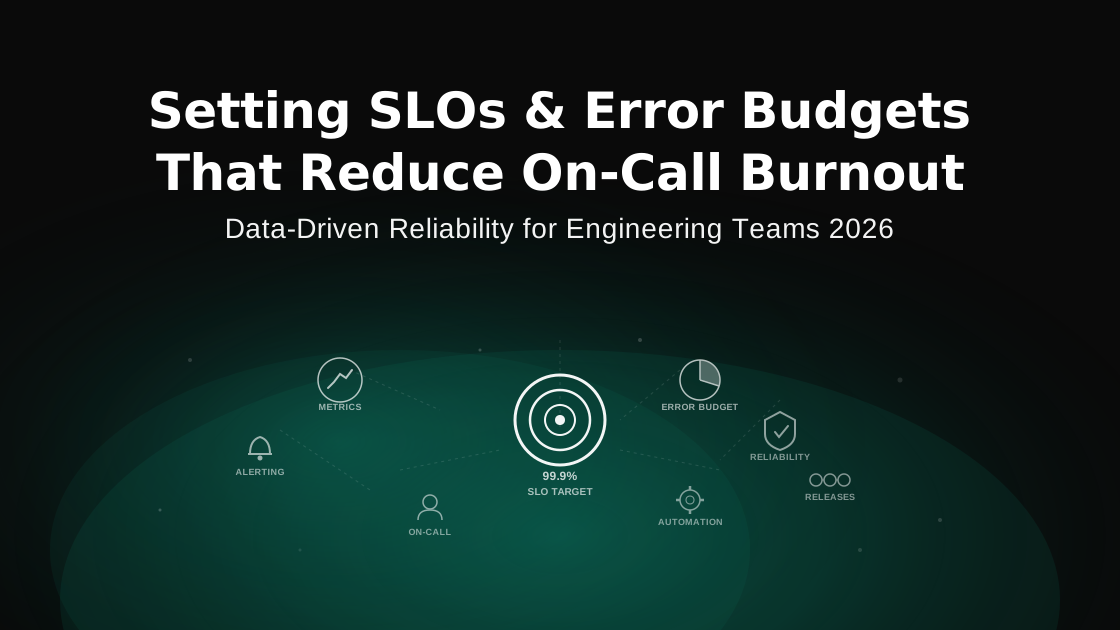
Why Most SLOs Fail
Every SRE team eventually adopts SLOs. Most get them wrong on the first attempt. The pattern is predictable: a team reads the Google SRE book, picks an arbitrary availability target like 99.9%, sets up a dashboard, and then ignores it because nothing in their workflow actually changes based on that number.
The problem is not with SLOs as a concept. The problem is that teams treat SLO design as a metrics exercise when it is actually an organizational decision. A well-designed SLO changes how you deploy code, how you prioritize sprint work, and how often your on-call engineer gets paged at 2 AM. A poorly designed one is just another dashboard nobody checks.
This guide covers the practical mechanics of SLO design: how to pick the right indicators, calculate error budgets, build policies that enforce them, and connect the entire system to on-call rotation health. If you have already completed an SRE maturity assessment, SLO design is typically the next capability to build.
SLO Design Fundamentals: The SLI → SLO → Error Budget Chain
Before writing a single alert rule, you need to understand the three-part chain that makes SLOs operational. Each component feeds directly into the next.
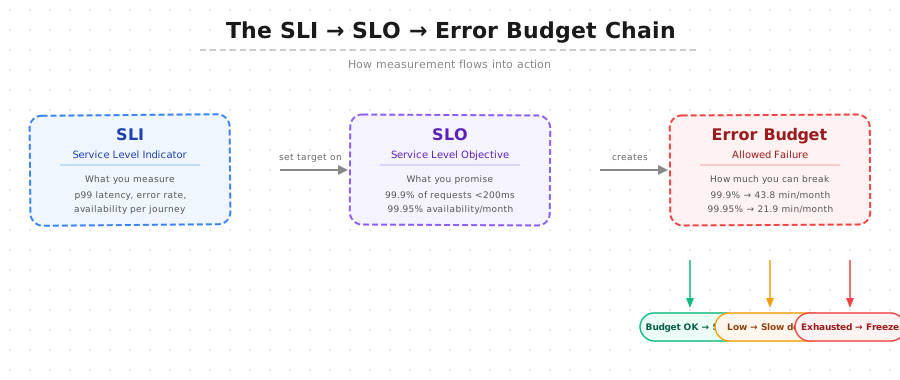
SLI (Service Level Indicator) is the raw metric you measure. Good SLIs are ratios: successful requests divided by total requests, or requests faster than a threshold divided by total requests. Bad SLIs are raw counts or averages that hide user-impacting problems behind healthy-looking numbers.
SLO (Service Level Objective) is the target you set on that SLI. "99.9% of checkout requests complete within 400ms over a rolling 30-day window." The SLO makes the SLI actionable by defining what "good enough" looks like for your users.
Error Budget is the inverse of the SLO — the amount of unreliability you can tolerate. A 99.9% SLO means you have a 0.1% error budget, which translates to roughly 43.8 minutes of downtime per month. This budget is what you "spend" on deployments, experiments, and maintenance windows.
The chain only works when all three components are connected to real decisions. The SLI feeds the SLO dashboard, the SLO dashboard feeds the error budget tracker, and the error budget tracker feeds your deployment pipeline and sprint planning.
The Math That Matters: Error Budget by SLO Target
Teams often pick SLO targets based on what sounds impressive rather than what their service actually needs. The difference between 99.9% and 99.99% is not just a decimal point — it is a 10x reduction in your room for error and a corresponding increase in infrastructure cost and on-call pressure.
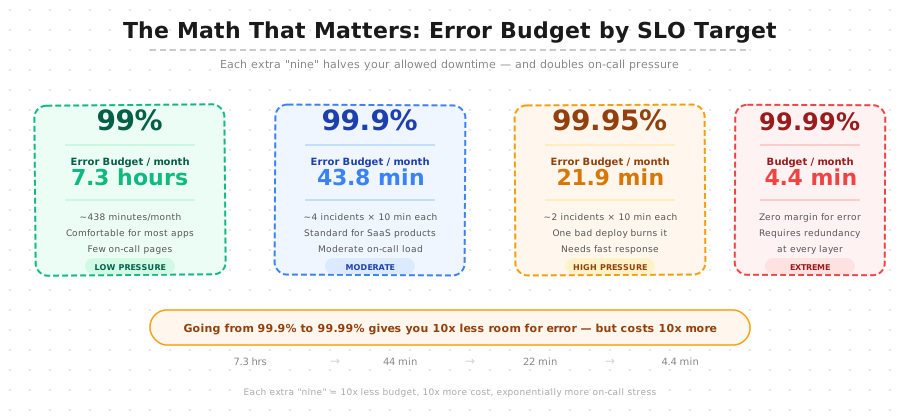
The table below breaks down the monthly error budget for common SLO targets:
| SLO Target | Monthly Error Budget | Practical Meaning | Infrastructure Cost Impact |
|---|---|---|---|
| 99% | 7.3 hours | Comfortable for internal tools | Single-region, basic redundancy |
| 99.5% | 3.65 hours | Adequate for non-revenue services | Single-region with failover |
| 99.9% | 43.8 minutes | Standard for most SaaS products | Multi-AZ, automated failover |
| 99.95% | 21.9 minutes | One bad deploy burns the budget | Multi-AZ with hot standby |
| 99.99% | 4.4 minutes | Zero margin — requires redundancy at every layer | Multi-region, active-active |
The infrastructure cost column matters more than teams realize. Going from 99.9% to 99.99% typically requires multi-region active-active architecture, which can double or triple your cloud spend. Tools like SpendZero help track whether the additional reliability investment delivers proportional business value, but the decision should start with understanding what your users actually need.
Picking the Right Target
Start by looking at your current baseline. If your service is already running at 99.95% without any SLO-driven work, setting a 99.9% target gives you meaningful budget to work with. Setting a 99.99% target for a service that currently achieves 99.5% creates an immediate and permanent budget violation that makes the SLO useless.
A practical approach: measure your service's actual reliability over 90 days, then set the SLO slightly below that baseline. This gives you a real error budget to manage from day one, rather than starting in a deficit.
Choosing the Right SLIs for Your Service
The SLI you choose determines whether your SLO measures something users care about or something that just looks good on a dashboard. There are four categories of SLIs that cover most services.
Availability SLIs
The ratio of successful requests to total requests. A request is "successful" if it returns a non-error HTTP status code (typically 2xx or 3xx). This is the most common SLI and the easiest to implement, but it misses performance problems entirely — a request that takes 30 seconds but returns 200 counts as successful.
Latency SLIs
The ratio of requests faster than a threshold to total requests. Use percentile-based thresholds: "99% of requests complete within 500ms" is more useful than "average latency under 200ms." Averages hide long-tail latency spikes that affect your most data-heavy users.
Correctness SLIs
The ratio of correct responses to total responses. This matters for services that can return 200 OK with wrong data — payment calculations, search results, recommendation engines. Correctness SLIs require application-level validation, not just HTTP status code checks.
Freshness SLIs
The ratio of data updates delivered within the expected timeframe. Relevant for data pipelines, caching layers, and any system where stale data degrades user experience. If your dashboard should update every 5 minutes, the freshness SLI tracks how often it actually does.
SLI Selection by Service Type
| Service Type | Primary SLI | Secondary SLI | Notes |
|---|---|---|---|
| API Gateway | Availability (non-5xx ratio) | Latency (p99 < 200ms) | Exclude health check endpoints from the count |
| Web Application | Latency (p95 < 400ms) | Availability | Measure from the user's browser, not the server |
| Data Pipeline | Freshness (< 15 min lag) | Correctness | Include end-to-end lag, not just processing time |
| Payment Service | Correctness (amount match) | Availability | False positives (blocking good payments) count as failures |
| Search / ML Inference | Latency (p99 < 1s) | Correctness (relevance) | Relevance requires offline quality metrics as a proxy |
Start with 2-3 SLIs per service. More than 5 creates monitoring overhead that teams cannot sustain. You can always add more once the initial set is well-understood and the measurement pipeline is stable.
Building an Error Budget Policy
An error budget without a policy is just a number. The policy defines what happens when the budget gets low and what happens when it runs out. Without this, the SLO has no teeth.
Budget Thresholds and Actions
A practical error budget policy has three zones:
| Budget Remaining | Zone | Actions |
|---|---|---|
| > 50% | Green | Normal feature velocity. Deploy as planned. Run experiments freely. |
| 20-50% | Yellow | Increase rollout caution. Canary deployments mandatory. Defer non-critical infrastructure changes. |
| < 20% | Red | Freeze feature deployments. All engineering effort shifts to reliability. Root-cause analysis required for every budget-consuming event. |
| Exhausted (0%) | Frozen | Complete deployment freeze for non-reliability work. Incident review for every SLO violation. Reliability work only until budget recovers. |
Who Owns the Policy?
The error budget policy needs sign-off from both engineering leadership and product management. Without product buy-in, the first time a deployment freeze blocks a feature release, leadership will override the policy and the entire SLO framework loses credibility.
Document the policy in a shared wiki, review it quarterly, and include it in your SRE practice documentation. Make the current budget status visible on a team dashboard that product managers can check before requesting feature deployments.
Release Gating with Error Budgets
The most impactful application of error budgets is automated release gating. Instead of manually checking dashboards before each deployment, integrate budget checks directly into your CI/CD pipeline.
How Release Gating Works
Before a deployment proceeds to production, the pipeline queries the current error budget status. If the budget is in the green zone, the deployment proceeds automatically. If it is in the yellow zone, the deployment requires manual approval from the on-call engineer. If the budget is in the red zone or exhausted, non-reliability deployments are blocked entirely.
This approach works because it removes the human judgment from routine decisions. Engineers do not need to debate whether "this deploy is safe enough" — the budget answers that question objectively.
Implementation Pattern
Most teams implement this as a pre-deployment check in their CI/CD pipeline. The check queries the SLO monitoring system (Prometheus, Datadog, or your observability stack) for the current burn rate and remaining budget, then returns a pass/fail/warn status that gates the deployment stage.
# Simplified release gate logic
remaining_budget = query_error_budget(service="checkout", window="30d")

if remaining_budget > 0.50:
    status = "PASS"        # Deploy automatically
elif remaining_budget > 0.20:
    status = "WARN"        # Require manual approval
else:
    status = "BLOCK"       # Only reliability fixes allowed
The key detail: the gate should check burn rate, not just remaining budget. A service with 60% budget remaining but a burn rate that will exhaust the budget in 2 days should trigger a yellow zone response, not a green one.
How SLOs Reduce On-Call Burnout
On-call burnout happens when engineers get paged for problems that either are not real, do not affect users, or cannot be fixed until morning. SLO-based alerting addresses all three failure modes.
From Threshold Alerts to Burn Rate Alerts
Traditional monitoring alerts on static thresholds: "CPU above 80%", "latency above 500ms", "error rate above 1%." These thresholds generate noise because they fire on transient spikes that self-resolve, on expected traffic patterns (high CPU during batch jobs), and on conditions that look concerning but do not actually affect user experience.
SLO-based alerting replaces threshold alerts with burn rate alerts. A burn rate alert fires when the error budget is being consumed faster than expected — meaning the service is on track to violate its SLO before the measurement window ends. This approach naturally filters out transient spikes (they do not burn enough budget to trigger) and irrelevant infrastructure metrics (only user-facing SLI violations matter).
Multi-Window Burn Rate Alerting
Google's SRE workbook recommends a multi-window, multi-burn-rate approach. This means setting up two types of alerts:
Fast burn alerts detect rapid budget consumption — situations where the error budget will be exhausted within hours. These are paging alerts that should wake someone up. Example: a burn rate of 14x (consuming 14 hours of budget per hour) sustained for 5 minutes means the service will exhaust its monthly budget in about 2 days if the issue continues.
Slow burn alerts detect gradual degradation — situations where the error budget will run out before the window resets, but not urgently. These are ticket alerts that should be investigated during business hours. Example: a burn rate of 1.5x sustained for 6 hours indicates a low-grade issue that is slowly eroding reliability.
Teams that switch from threshold alerting to burn rate alerting typically see a 60-80% reduction in paging volume. The remaining pages are almost always actionable, which is the difference between sustainable on-call and burnout. For a deeper treatment of alert tuning and on-call rotation design, see our guide on reducing alert fatigue.
Escalation Tied to Budget Zones
Connect your escalation policy to the error budget zones defined earlier. Green zone incidents escalate normally (on-call handles, no rush). Yellow zone incidents get faster escalation and an incident commander. Red zone incidents trigger immediate multi-team response because the service is already near its reliability limit.
This graduated response prevents two failure modes: over-escalating minor issues (which interrupts too many people) and under-escalating serious issues (which lets them compound until the budget is gone).
Integrating SLOs with Sprint Planning
SLOs become truly effective when they influence how you plan engineering work, not just how you respond to incidents. The error budget provides an objective input for the reliability-vs-features tradeoff that every engineering team faces.
The Budget-Based Capacity Model
At the start of each sprint, check the error budget status for each service the team owns. If any service is in the yellow or red zone, allocate a fixed percentage of sprint capacity to reliability work for that service. A common starting point:
| Budget Zone | Reliability Allocation | Feature Allocation |
|---|---|---|
| Green (> 50%) | 10-15% (maintenance) | 85-90% |
| Yellow (20-50%) | 30-40% | 60-70% |
| Red (< 20%) | 60-80% | 20-40% |
| Exhausted | 100% | 0% (freeze) |
This model gives product managers predictable expectations. They know that if the team's services are healthy, they get full velocity. If reliability degrades, feature work slows — not because engineers are being difficult, but because the error budget objectively requires attention.
Quarterly SLO Reviews
Review SLO targets and error budget policies quarterly. The review should answer: Are the targets still appropriate for the service's user base and business criticality? Did the error budget policy actually trigger during the quarter, and did the team follow it? Are there SLIs that should be added or retired based on incident patterns?
Adjusting SLOs based on operational data is not a failure — it is how mature SRE practices evolve. A target that is never violated may be too loose. A target that is always violated may be too aggressive, or the service may need architectural investment that SLO tuning cannot fix.
Common SLO Design Pitfalls
After working with engineering teams across organizations, these are the mistakes that come up repeatedly.
Pitfall 1: Measuring Server Health Instead of User Experience
SLIs like "server CPU under 70%" or "pod restart count under 5" measure infrastructure health, not user experience. A server at 90% CPU that serves all requests within SLO is healthier (from the user's perspective) than a server at 20% CPU that intermittently drops connections. Always tie SLIs to user-facing behavior.
Pitfall 2: Setting Targets Based on Marketing, Not Engineering
Sales teams love "five nines" in pitch decks. Engineering teams that adopt 99.999% as an SLO without the architecture to support it create a permanent budget violation that nobody takes seriously. Your SLO should reflect your actual capabilities, with a realistic improvement trajectory.
Pitfall 3: No Error Budget Policy
An SLO without a budget policy is a suggestion. The first time a team violates its SLO and nothing happens — no deployment freeze, no sprint reallocation, no incident review — the SLO is dead. Teams learn that the target is aspirational, not operational.
Pitfall 4: Too Many SLOs
Teams that define 15 SLOs per service cannot track any of them meaningfully. Start with the 2-3 that matter most to users. You can expand later once the measurement and policy infrastructure is mature.
Pitfall 5: Using Averages Instead of Percentiles
Average latency of 100ms sounds good. But if 1% of requests take 10 seconds, your heaviest users (who make the most requests) are having a terrible experience. Percentile-based SLIs (p95, p99) capture tail latency that averages hide.
Pitfall 6: Never Adjusting the Target
SLOs are not permanent commitments. A service that was 99.5% reliable at launch might need 99.95% after it becomes business-critical. A service that was over-targeted at 99.99% might need to relax to 99.9% to allow faster iteration. Quarterly reviews keep targets aligned with business needs.
Getting Started: SLO Implementation Checklist
If your team is starting from scratch, follow this sequence:
| Step | Action | Typical Timeline |
|---|---|---|
| 1 | Identify your 3 most critical user journeys | Week 1 |
| 2 | Instrument SLIs (availability + latency at minimum) | Weeks 2-3 |
| 3 | Measure baseline reliability over 30 days | Weeks 4-7 |
| 4 | Set initial SLO targets (slightly below baseline) | Week 8 |
| 5 | Draft error budget policy with product manager sign-off | Week 8-9 |
| 6 | Set up burn rate alerts (replace threshold alerts) | Weeks 9-10 |
| 7 | Integrate budget status into sprint planning | Week 11 |
| 8 | Add release gating to CI/CD pipeline | Weeks 12-13 |
| 9 | First quarterly review and target adjustment | Week 20 |
The entire implementation takes about 3-5 months for a team's first service. Subsequent services are faster because the instrumentation patterns, policy templates, and alerting configurations can be reused.
When to Get External Help
SLO implementation is straightforward conceptually but tricky in practice. Common sticking points include: choosing the right SLI boundaries for complex distributed systems, instrumenting SLIs in legacy services with limited observability, getting product management buy-in for error budget policies, and tuning burn rate alert thresholds to minimize noise without missing real issues.
If your team is spending more than a quarter on SLO implementation without seeing a reduction in on-call pages or a clearer reliability-vs-features tradeoff, bringing in an experienced SRE consulting partner can compress the timeline from months to weeks. The value is not in the SLO math — it is in the organizational patterns that make the math actionable. Teams that have been through a managed SRE engagement typically have the tooling and culture to self-serve after the initial setup.